StudentShare
Contact Us
Sign In / Sign Up for FREE
Search
Go to advanced search...
Free

Standard Deviation and Outliers - Assignment Example

Cite this document
Summary
You will not be able to see your classmates’ posts until after you have made your own post. This is intentional. You must use your own work for answers to questions 1–5. If something happens that leads you to want to make…
Download full paper File format: .doc, available for editing
GRAB THE BEST PAPER91.5% of users find it useful
Standard Deviation and Outliers
Read Text Preview

Extract of sample "Standard Deviation and Outliers"

Discussion Board Project 2 Instructions Standard Deviation and Outliers Thread: For this assignment you will use the Project 2 Excel Spreadsheet to answer the questions below. Use the spreadsheet to create the graphs as described in each question and then answer the question.Put all of your answers into a post in the Project 2 Discussion Board Forum.This course will be utilizing the Post-First feature. You will not be able to see your classmates’ posts until after you have made your own post.

This is intentional. You must use your own work for answers to questions 1–5. If something happens that leads you to want to make a 2nd post for any of your answers to questions 1–5, you must get permission from your instructor.1. a) Create a set of 5 points that are very close together and record the standard deviation. Next, add a 6th point that is far away from the original 5 and record the new standard deviation.What is the impact of the new point on the standard deviation? Do not just give a numerical value for the change.

Explain what happened to the standard deviation in words. (4 points)The standard deviation for the set of 5 points {2, 3, 4, 5 and 6} that are very close together is about 1.58. When a 6th point {20} that is far away from the original 5 points is added the new standard deviation becomes 6.68. Thus, it can be seen that a single point that is far away from all the points increases the standard deviation by a big amount that is from 1.58 to 6.68. Therefore, there is a great impact of the new point on the standard deviation.b) Create a data set with 8 points in it that has a mean of approximately 10 and a standard deviation of approximately 1.

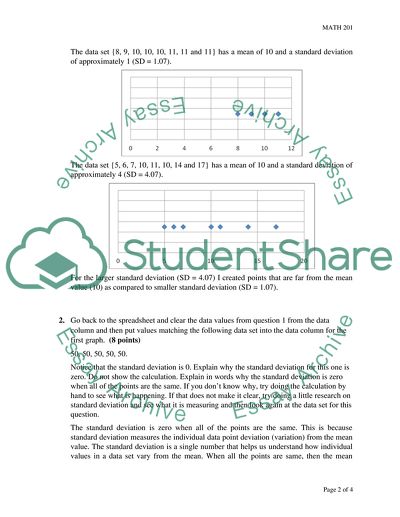
Use the 2nd chart to create a second data set with 8 points that has a mean of approximately 10 and a standard deviation of approximately 4. What did you do differently to create the data set with the larger standard deviation? (4 points)The data set {8, 9, 10, 10, 10, 11, 11 and 11} has a mean of 10 and a standard deviation of approximately 1 (SD = 1.07).The data set {5, 6, 7, 10, 11, 10, 14 and 17} has a mean of 10 and a standard deviation of approximately 4 (SD = 4.07).For the larger standard deviation (SD = 4.07) I created points that are far from the mean value (10) as compared to smaller standard deviation (SD = 1.07). 2.

Go back to the spreadsheet and clear the data values from question 1 from the data column and then put values matching the following data set into the data column for the first graph. (8 points)50, 50, 50, 50, 50. Notice that the standard deviation is 0. Explain why the standard deviation for this one is zero. Do not show the calculation. Explain in words why the standard deviation is zero when all of the points are the same. If you don’t know why, try doing the calculation by hand to see what is happening.

If that does not make it clear, try doing a little research on standard deviation and see what it is measuring and then look again at the data set for this question.The standard deviation is zero when all of the points are the same. This is because standard deviation measures the individual data point deviation (variation) from the mean value. The standard deviation is a single number that helps us understand how individual values in a data set vary from the mean. When all the points are same, then the mean value will be also the same point and hence deviation of all the data points from the mean value will be zero.

Since, the deviation of all the data points from the mean value is zero in this case; therefore, the standard deviation is zero when all of the points are the same.The formula for the standard deviation of a sample is given by: When all the value are the same then mean value, will be also the same and hence the value of for individual data point will be zero, and the sum will be also zero. Therefore, the standard deviation is zero when all of the points are the same.3. Go back to the spreadsheet one last time and put each of the following three data sets into one of the graphs.

Record what the standard deviation is for each data set and answer the questions below. Data set 1: 0, 25, 50, 75, 100 Data set 2: 30, 40, 50, 60, 70 Data set 3: 40, 45, 50, 55, 60Note that all three data sets have a median of 50. Notice how spread out the points are in each data set and compare this to the standard deviations for the data sets. Describe the relationship you see between the amount of spread and the size of the standard deviation and explain why this connection exists. Do not give your calculations in your answer — explain in words.

(8 points)The standard deviation for the Data set 1 is 39.53, for the Data set 2 is 15.81 and for the Data set 3 is 7.91. Thus, it can be seen that the more spread out the points are in a data set the larger the standard deviation value and the less spread out the points are in a data set the smaller the standard deviation value. Thus, the relationship I see between the amount of spread and the size of the standard deviation is a direct relationship that is as the amount of spread increases the size of the standard deviation increases and vice-versa.

The reason for this is that the standard deviation is a single number that helps us understand how individual values in a data set vary from the mean. When individual values are far from the mean, the variation is more and hence, the size of standard deviation is large. However, when individual values are close to the mean, the variation is less and hence, the size of standard deviation is small.For the last 2 questions, use the Project 1 Data set that is found in Course Content >> Syllabus and Assignment Instructions >> Assignment Instructions in Blackboard.4. Explain what an outlier is.

Then, if there are any outliers in the Project 1 Data Set, what are they? If there are no outliers, say no outliers. (4 points)An outlier is an extreme value that is far enough from the majority of the data that it probably arose from a different cause or is due to measurement error. In general, any value three or more standard deviation from the mean value is considered as the outlier value.The mean temperature for all the 50 states is 96.08 and the standard deviation is 12.88. Therefore, any value outside the interval (57.45, 134.71) will be considered as the outlier value.

There are two outlier in the project 1; they are 37 for Florida (FL) and 49 for the Texas (TX).5. Which 4 temperatures in the data set look to be the most questionable or the most unrealistic to you? Explain why you selected these 4 points. (4 points)In my opinion, there are only 2 temperatures in the data set look to be the most questionable or the most unrealistic to me. They are 37 for Florida (FL) and 49 for the Texas (TX). The reason might be typing error or because both are Southern states.

The temperatures for both states in the data set look to be the most questionable (or the most unrealistic ) because the maximum temperature for the other Southern states Louisiana (LA-97), Mississippi (MS-97), Alabama (Al-97) and Georgia (GA-99) are quite higher (and the same) as compared to the Florida and Texas.However, if I have to select 4 temperatures in the data set look to be the most questionable or the most unrealistic to me, I will select another two values 88 for North Dakota (ND) and 111 for Kansas (KS) because they are slightly different from their neighboring states.

Replies:After you have made your post, you will be able to see your classmates’ posts. Find 2 classmates who disagreed with at least some part of at least one of your answers to questions 4 and 5 and explain why your answers are correct. If after reading some of your classmates’ posts, you change your mind about the right answers for questions 4 and 5, explain what you were thinking originally as well as what you think now and why.(8 points)Submit your answers to these questions by 11:59 p.m. (ET) on Saturday of Module/Week 3.

Submit your 2 replies of at least 50 words each by 11:59 p.m. (ET) on Monday of Module/Week 3.

Read More
Cite this document
  • APA
  • MLA
  • CHICAGO
(“Standard Deviation and Outliers Assignment Example | Topics and Well Written Essays - 250 words”, n.d.)
Standard Deviation and Outliers Assignment Example | Topics and Well Written Essays - 250 words. Retrieved from https://studentshare.org/statistics/1696171-standard-deviation-and-outliers
(Standard Deviation and Outliers Assignment Example | Topics and Well Written Essays - 250 Words)
Standard Deviation and Outliers Assignment Example | Topics and Well Written Essays - 250 Words. https://studentshare.org/statistics/1696171-standard-deviation-and-outliers.
“Standard Deviation and Outliers Assignment Example | Topics and Well Written Essays - 250 Words”, n.d. https://studentshare.org/statistics/1696171-standard-deviation-and-outliers.
  • Cited: 0 times

CHECK THESE SAMPLES OF Standard Deviation and Outliers

Memory Process Serial Position Effect

) with standard deviation of 4.... Participant used a standard mouse to enter their input in the computer.... During our day, we are faced with situation were we must memorize different things.... Scientists have been concerned to understand how we remember things....
4 Pages (1000 words) Lab Report

Comprehensive Statistics

This assignment "Comprehensive Statistics" discusses four levels of measurement data, the advantages and disadvantages of the bar chart, pie and Pareto diagram, the mean, mode and median as measures of central tendencies of data, the empirical rule and mutually exclusive and collectively exhaustive events....
6 Pages (1500 words) Assignment

Normal Distribution

Also, the standard deviation will likely be small in order to help the curve remain tall and narrow.... If a curve is bell-shaped, then more than two thirds of the distribution (68%) will lie between one standard deviation of the mean.... This theorem states that as long as there are a significantly large number of variables involved in the sampling process, then the average, or mean, will approximately located at the… This is important when interpreting data because the best results can be attained through a sampling process that has very few outliers....
2 Pages (500 words) Essay

FREQUENCY DISTRIBUTIONS

It helps in the calculation of, measures of central tendencies, for example, the mean, as well as, measures of variations including the range, standard deviation, and variance.... The standard deviation is the square root of the variance.... The standard deviation of the above data is 9.... When defining normally distributed data, one must specify two quantities, including the mean (µ) and the standard deviation (σ).... Different values of the mean and standard deviation yield different normal curves thus different normal distributions....
3 Pages (750 words) Assignment

Managerial Report

The report will estimate the descriptive… The report will further find the outliers for each variable.... Four parameters are analyzed in the report: median household income, average years of schooling, average lifespan and average number of people per household.... The paper will then estimate the relationship between the median household income and three remaining variables....
7 Pages (1750 words) Essay

Distribution of a Variable

It is the relationship between the standard deviation and the range given by 13.... The term standard deviation sounds really scary, but it is not really a horrible monster what is it a measure of?... What is the formula we use to find the standard deviation of a set of data?... How do we use the standard deviation to estimate the high and low values of a data set?... About 68% of the data points fall within 1 standard deviation of the mean, about 95% data points fall within 2 standard deviation points of the mean and about 99....
3 Pages (750 words) Essay

Statistics for the Behavioral and Social Sciences

8 with a standard deviation of 0.... 163 (slightly less than the previous one) and standard error 0.... The 95% confidence interval has shrunk closer because the standard error has reduced drastically and the Confidence interval is (3.... "Statistics for the Behavioral and Social Sciences" paper analizes the study in which 1000 participants grouped into 2 groups, with one group of 500 participants getting the shot and another group of 500 participants getting nasal spray....
5 Pages (1250 words) Assignment
sponsored ads
We use cookies to create the best experience for you. Keep on browsing if you are OK with that, or find out how to manage cookies.
Contact Us