StudentShare
Contact Us
Sign In / Sign Up for FREE
Search
Go to advanced search...

Interpreting the Results of a Regression Analysis - Assignment Example

Cite this document
Summary
This assignment "Interpreting the Results of a Regression Analysis" focuses on the variables “no room” and “no eng” which account for relatively smaller variability in the response that does “fiction”. In fact, both cumulatively were only attributed to 2% of the variation in the first model…
Download full paper File format: .doc, available for editing
GRAB THE BEST PAPER98% of users find it useful
Interpreting the Results of a Regression Analysis
Read Text Preview

Extract of sample "Interpreting the Results of a Regression Analysis"

Download file to see previous pages

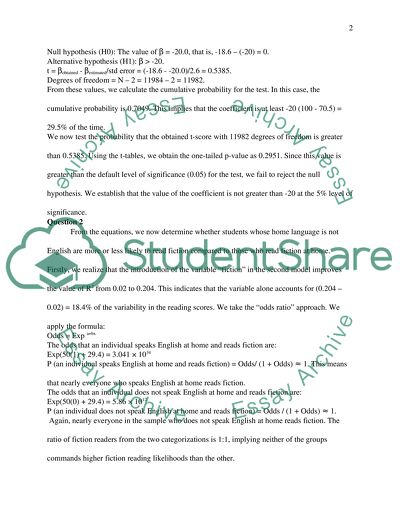
In this case, the cumulative probability is 0.7049. This implies that the coefficient is at least -20 (100 - 70.5) = 29.5% of the time. We now test the probability that the obtained t-score with 11982 degrees of freedom is greater than 0.5385. Using the t-tables, we obtain the one-tailed p-value as 0.2951. Since this value is greater than the default level of significance (0.05) for the test, we fail to reject the null hypothesis. We establish that the value of the coefficient is not greater than -20 at the 5% level of significance.

From the equations, we now determine whether students whose home language is not English are more or less likely to read fiction compared to those who read fiction at home. Firstly, we realize that the introduction of the variable “fiction” in the second model improves the value of R2 from 0.02 to 0.204. This indicates that the variable alone accounts for (0.204 – 0.02) = 18.4% of the variability in the reading scores. We take the “odds ratio” approach. We apply the formula: Again, nearly everyone in the sample who does not speak English at home reads fiction.

The ratio of fiction readers from the two categorizations is 1:1, implying neither of the groups commands higher fiction reading likelihoods than the other. In the variable “fiction” were to be split into constituent components based on the Likert scale rankings earlier used, such that “fict5” indicates “I like reading fiction very much” and so on, we would have to change the variable responses from scale to dummies. We assume that if an individual who says responding to “fict5” mentions that they “do not like reading fiction very much” will be accorded 0 for the response, and 1 for “I like reading fiction very much”.

The variable “fict3” is the transition between responses that affirm or disaffirm the proposal/ question. This is highlighted by the fact that the scale used has 5 points.

...Download file to see next pages Read More
Cite this document
  • APA
  • MLA
  • CHICAGO
(“Econometrics assignment Example | Topics and Well Written Essays - 1250 words”, n.d.)
Econometrics assignment Example | Topics and Well Written Essays - 1250 words. Retrieved from https://studentshare.org/statistics/1662775-econometrics-assignment
(Econometrics Assignment Example | Topics and Well Written Essays - 1250 Words)
Econometrics Assignment Example | Topics and Well Written Essays - 1250 Words. https://studentshare.org/statistics/1662775-econometrics-assignment.
“Econometrics Assignment Example | Topics and Well Written Essays - 1250 Words”, n.d. https://studentshare.org/statistics/1662775-econometrics-assignment.
  • Cited: 0 times

CHECK THESE SAMPLES OF Interpreting the Results of a Regression Analysis

Statistical Inference and Regression

Statistical Inference and regression Name Institution Statistics is the study that involves collecting, organizing, analyzing, and interpreting data.... This paper discusses statistical inferences and cuts across other areas of statistics including regression, linear regression, nonlinear regression, least-squires method, and the maximum likelihood method.... Descriptive statistics is particularly useful in research work especially when communicating the experimental results....
10 Pages (2500 words) Essay

Interpretation of Regression Results

The multiple regression analysis has not only highlighted the relationship between the dependent and independent variables but it has also explained the extent to which these variables are.... Following are the details of the regression model and the interpretation of the results drawn from the regression analysis. ... he standard error shows the amount of variability of the data points around the regression line and in this regression analysis, the standard errors for all the variables is very small....
5 Pages (1250 words) Essay

Analysis of Domestic Violence Articles Using ANOVA

the results also showed that women who have been fooled into marriage without their knowledge experience minor physical assault, severe physical assault and minor psychological aggression.... The author concludes that the observation that can be made from the above journal articles is that all of them have used many variables in their analysis.... A number of methods of statistical data analysis are used and these include: factor analysis, correlations analyses, ANOVA and multiple regression analyses....
2 Pages (500 words) Essay

The Relationship Between the Gross Domestic Product and the Balance of Trade

Statistics entails the whole process of collecting samples, organizing, analyzing them eventually interpreting the data for useful applications.... This paper assumed a non-positive correlation between the gross domestic product and the international trade for the population of analysis.... The development of statistics and more specifically quantitative analysis methods is majorly due to the inability to identify the characteristics of interest in most instances of the business decision-making process....
9 Pages (2250 words) Essay

Psychology Portfolio Issues

There is even a study finding that indicates the use of regression analysis in the study of interaction effects.... In such cases, the results yielded do not represent the accuracy of the hypothesized concepts.... The assignment "Psychology Portfolio Issues" focuses on the critical analysis of the major issues in the psychology portfolio.... The first part will concern conducting and interpreting statistical analysis while the second will deal with experimental design....
5 Pages (1250 words) Assignment

Regression Analysis

The following assignment provides the regression analysis of labor.... regression analysis.... regression analysis.... The author of the analysis presents certain results of the research.... The received data shows that an addition of 10000 non-labor income will reduce the number of female in labor participation by (0....
1 Pages (250 words) Assignment

Financial Sector Across the Eurozone

Implementation of the regression model discussed in the earlier section yielded the regression statistics in Table 2.... The failure to get consistent results from the relationship between financial ratios and firm profitability can also indicate that regression strategies on how to conduct the regression must be refined.... This mean s that studies on the subject must be sustained until a more satisfactory set of results are obtained or consistent results are obtained from a large number of studies on the subject....
8 Pages (2000 words) Research Paper

Risk and Return for BHP Billiton

The paper 'Risk and Return for BHP Billiton' is an affecting variant of a report on finance & accounting.... BHP Billiton is a worldwide natural resource corporation.... The business was registered and put into operation in the year 2001 by the amalgamation of BHP and Billiton Plc.... The business is in the dealing of mining of ore, steel coil, and gasses....
9 Pages (2250 words)
sponsored ads
We use cookies to create the best experience for you. Keep on browsing if you are OK with that, or find out how to manage cookies.
Contact Us