StudentShare
Contact Us
Sign In / Sign Up for FREE
Search
Go to advanced search...
Free

Independent Samples Test - Statistics Project Example

Cite this document
Summary
The paper "Independent Samples Test" highlights that based on Levene's Test for Equality of Variances, which puts the level of significance (p-value) at 0.229, we use the equal variance result. This decision is made considering that the p-value, in this case, is greater than 0.05.  …
Download full paper File format: .doc, available for editing
GRAB THE BEST PAPER95.9% of users find it useful
Independent Samples Test
Read Text Preview

Extract of sample "Independent Samples Test"

Descriptive Statistics
Group Statistics
Movie Type N Mean Std. Deviation Std. Error Mean
Empathy score Group M & D 1.00 15 79.5333 8.76573 2.26330
2.00 15 61.8667 11.04450 2.85168

Independent Samples Test
Levene's Test for Equality of Variances t-test for Equality of Means

F Sig. t
Empathy score Group M & D Equal variances assumed 1.513 .229 4.853
Equal variances did not assume 4.853

Independent Samples Test
t-test for Equality of Means

df Sig. (2-tailed) Mean Difference
Empathy score Group M & D Equal variances assumed 28 .000 17.66667
Equal variances did not assume 26.627 .000 17.6666

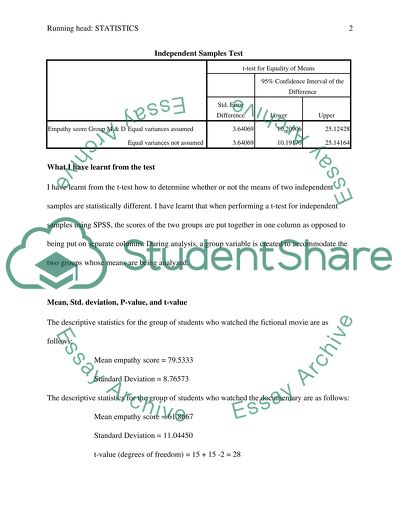
Independent Samples Test
t-test for Equality of Means
95% Confidence Interval of the Difference
Std. Error Difference Lower Upper
Empathy score Group M & D Equal variances assumed 3.64069 10.20906 25.12428
Equal variances did not assume 3.64069 10.19170 25.14164

What I have learned from the test
I have learned from the t-test how to determine whether or not the means of two independent samples are statistically different. I have learned that when performing a t-test for independent samples using SPSS, the scores of the two groups are put together in one column as opposed to being put in separate columns. During analysis, a group variable is created to accommodate the two groups whose means are being analyzed.

Mean, Std. deviation, P-value, and t-value
The descriptive statistics for the group of students who watched the fictional movie are as follows:
Mean empathy score = 79.5333
Standard Deviation = 8.76573
The descriptive statistics for the group of students who watched the documentary are as follows:
Mean empathy score = 61.8667
Standard Deviation = 11.04450
t-value (degrees of freedom) = 15 + 15 -2 = 28
p-value = 0.000

What the results mean:
For this test, the hypotheses are as follows:
Null hypothesis (H0): There is no significant difference between the mean scores of the students who watched the movie and those who watched the documentary.
Alternative hypothesis (H1): There is no significant difference between the mean scores of the students who watched the movie and those who watched the documentary. Read More
Cite this document
  • APA
  • MLA
  • CHICAGO
(“Statistics Project Example | Topics and Well Written Essays - 500 words - 5”, n.d.)
Statistics Project Example | Topics and Well Written Essays - 500 words - 5. Retrieved from https://studentshare.org/statistics/1628648-statistics
(Statistics Project Example | Topics and Well Written Essays - 500 Words - 5)
Statistics Project Example | Topics and Well Written Essays - 500 Words - 5. https://studentshare.org/statistics/1628648-statistics.
“Statistics Project Example | Topics and Well Written Essays - 500 Words - 5”, n.d. https://studentshare.org/statistics/1628648-statistics.
  • Cited: 0 times

CHECK THESE SAMPLES OF Independent Samples Test

Respondents' Attitude toward Factors of Internet Shopping

Throughout the study, the author has mainly done the analysis part with the help of one-way ANOVA and T-test.... The single factor ANOVA is used to differentiate between the mean values of two or more samples with the application of the F test (people.... After the vivid description of the ANOVA technique, we would now discuss the T-test.... It is conducted for testing statistical hypothesis in which the statistics of the test pursue a Student's t distribution in the case when the null hypothesis is supported....
10 Pages (2500 words) Assignment

Spss assingment

Independent Samples Test tdfStd.... 64 Independent Samples Test tdfSig.... The t-test shows that, the score with and without a calculator is statistically different at 95% level of significance with a p = .... in this case, the comparison of the means in the best test used since mean measures centrally the whole data....
2 Pages (500 words) Speech or Presentation

Causality and Inference: Tests of Difference and Relationship

The presence of a weapon word (such as “dagger” or “bullet”) should increase the accessibility of an aggressive word (such as.... ... ... This study by Anderson, Benjamin, and Bartholow (1998) tested this hypothesis. ... ... n this project, data is used from the case, Weapons and Aggression....
5 Pages (1250 words) Assignment

T-test and Correlation

he test selected is two-tailed t-test for independent samples (Independent Samples Test) because alternate hypothesis involves not equal to sign (≠).... ndependent samples test ... The paper "T-test and Correlation" analyzes difference in the percentage usage of prepositions in writing between native and non native speaker of English in their texts.... T-test and Correlation This paper will analyze difference in the percentage usage of prepositions in writing between native and non native speaker ofEnglish in their texts....
2 Pages (500 words) Statistics Project

Chi-Squared Testing

In the essay 'Chi-Squared Testing' the author provides the one-sample chi-square test to evaluate whether cooking method affects taste.... From the analysis of both the t-test and Mann Whitney U test, it is evident that there exists a significant difference in the average time.... Below we present a graphical representation to support the same;From the analysis, it is evident that the sample does not provide enough evidence to support the claim that there is a significant relationship between hair color and social extroversion hence we fail to reject the null hypothesis and conclude since the Kruska-Wallis test is not significant, a follow-up test is not necessary (Hollander, Wolfe, & Chicken, 2014)....
3 Pages (750 words) Essay

Case Study Computers R Us

Data was collected from 420 randomly selected participants.... Analysis was done using Statistical Package for Social Sciences (SPSS) version 16.... .... Results showed that.... ... ... there exists a disparity in regard to overall customer satisfaction between the female and male participants (male participants are more satisfied compared to their female counterparts)....
8 Pages (2000 words) Assignment

Analysis for Corporate Social Performance

From the table below, the p-value for Lavene's test is 0.... From the table below, the p-value for Lavene's test is 0.... rom the table below, the p-value for Lavene's test is 0.... From the table below, the p-value for Lavene's test is 0.... We can conclude that the differences between condition Means are likely due to chance and not likely due to the independent variable manipulation.... We can conclude that the differences between condition Means (for the employee turnover %) are likely due to chance and not likely due to the independent variable manipulation....
15 Pages (3750 words) Assignment

SPSS Analysis for Corporate Social Performance

From the table below, the p-value for Lavene's test is 0.... rom the table below, the p-value for Lavene's test is 0.... From the table below, the p-value for Lavene's test is 0.... We can conclude that the differences between condition Means are likely due to chance and not likely due to the independent variable manipulation.... We can conclude that the differences between condition Mean (for the community spend) are likely due to chance and not likely due to the independent variable manipulation....
27 Pages (6750 words) Report
sponsored ads
We use cookies to create the best experience for you. Keep on browsing if you are OK with that, or find out how to manage cookies.
Contact Us