StudentShare
Contact Us
Sign In / Sign Up for FREE
Search
Go to advanced search...
Free

Selecting Variables into a Regression Equation - Assignment Example

Cite this document
Summary
To develop a regression equation an imaginary study has been considered which is aimed at determining the effect of socio-economic conditions on injuries amongst children. For this study, the dependent variable is the number of injuries amongst children and the independent…
Download full paper File format: .doc, available for editing
GRAB THE BEST PAPER98.1% of users find it useful
Selecting Variables into a Regression Equation
Read Text Preview

Extract of sample "Selecting Variables into a Regression Equation"

Selecting Variables into a Regression Equation Selecting Variables into a Regression Equation To develop a regression equation an imaginary study has been considered which is aimed at determining the effect of socio-economic conditions on injuries amongst children. For this study, the dependent variable is the number of injuries amongst children and the independent variables (predictors) (Wang & Jain, 2003) and their assigned values are identified as parenting status (single, married, or divorced), parent education level (primary, college, or university), parent income level (Less than $20,000p.a., Between $20,001p.a. and $50,000p.a., Between $50,001p.a. and $100,000p.a., Above $100,000), density of population in neighborhood (low, medium, or high).

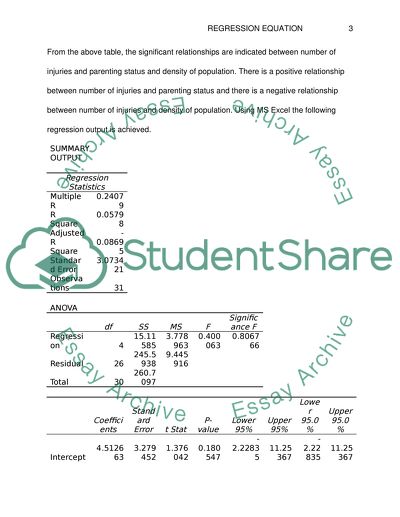
The data comprises of 31 observations for each variable. Using step wise approach to predicting the relationship between the dependent variable and independent variables, the correlations between these variables are determined as follows: Number of InjuriesNumber of Injuries1Parenting Status0.40Parent Education0.27Parent Income Level0.11Density of Population-0.30From the above table, the significant relationships are indicated between number of injuries and parenting status and density of population.

There is a positive relationship between number of injuries and parenting status and there is a negative relationship between number of injuries and density of population. Using MS Excel the following regression output is achieved.SUMMARY OUTPUTRegression StatisticsMultiple R0.24079R Square0.05798Adjusted R Square-0.08695Standard Error3.073421Observations31ANOVA dfSSMSFSignificance FRegression415.115853.7789630.4000630.806766Residual26245.59389.445916Total30260.7097    CoefficientsStandard Errort StatP-valueLower 95%Upper 95%Lower 95.

0%Upper 95.0%Intercept4.5126633.2794521.3760420.180547-2.2283511.25367-2.2283511.25367Parenting Status-0.478220.737032-0.648850.522125-1.993221.036767-1.993221.036767Parent Education0.1830280.7892770.2318930.818437-1.439351.805411-1.439351.805411Parent Income Level-0.10580.619629-0.170740.865748-1.379461.167868-1.379461.167868Density of Population0.737240.7049731.0457710.305292-0.711852.186333-0.711852.186333The regression model is only able to explain 5.8% of the total variations observed in 31 data entries (Kedem & Fokianos, 2002).

The above table indicates coefficients of correlation between dependent variable and independent variables. The following regression equation is achieved:Number of Injuries: 4.51 – 0.48 x Parenting Status + 0.18 x Parent Education - 0.11 x Income Level + 0.74 x Density of PopulationFrom the regression equation, it could be predicted that there is a negative relationship but not significant (p

Read More
Cite this document
  • APA
  • MLA
  • CHICAGO
(“Selecting Variables into a Regression Equation Assignment”, n.d.)
Selecting Variables into a Regression Equation Assignment. Retrieved from https://studentshare.org/statistics/1611158-selecting-variables-into-a-regression-equation
(Selecting Variables into a Regression Equation Assignment)
Selecting Variables into a Regression Equation Assignment. https://studentshare.org/statistics/1611158-selecting-variables-into-a-regression-equation.
“Selecting Variables into a Regression Equation Assignment”, n.d. https://studentshare.org/statistics/1611158-selecting-variables-into-a-regression-equation.
  • Cited: 0 times

CHECK THESE SAMPLES OF Selecting Variables into a Regression Equation

Description of Step-Wise Multiple Regression statistic test

Definition and Detailed Description of 'Stepwise Regression' According to Investopedia, Step-wise regression is a step-by-step iterative establishment of a regression model that necessitates automatic excerption of independent variables.... Introduction Stepwise regression is a partial-automated process of constructing a model by sequentially including or eliminating variables based only on the t-statistics values of their predicted coefficients.... … Introduction Stepwise regression is a partial-automated process of constructing a model by sequentially including or eliminating variables based only on the t-statistics values of their predicted coefficients....
10 Pages (2500 words) Essay

Quantitative Techniques ( use Eviews and Excel )

Table 2 Wald Test: equation: Untitled Test Statistic Value   df     Probability F-statistic 10.... ) Table 3 Chow Breakpoint Test: 2001Q1  Null Hypothesis: No breaks at specified breakpoints Varying regressors: All equation variables equation Sample: 1990Q2 2010Q3 F-statistic 26.... b) The equation would simply be rewritten by subtracting the group mean value from each of the variables of the group (mean centering).... Table 22 Wald Test: equation: Untitled Test Statistic Value   df     Probability F-statistic 10....
6 Pages (1500 words) Essay

Logistic Regression in Nursing Practice

The Way regression equation Is Used Regression equations are used to define the magnitude and direction of relation of one variable with another variable( simple regression) or the relation of a set of variables with another variable.... Therefore in this study the Health care usage was correlated in the equation by bivariate models and multivariate models.... multiple regression equations like logistic regression equations based on ordinary least squares or linear regression equations)....
4 Pages (1000 words) Essay

Difference Between The Regression Coefficients

It is also used to test whether the estimated variance of the residuals from regression equation is dependent on the values of independent variable values.... It is mentioned that the test is used to examine the effect of structural change due to price or policy alteration on a regression model.... The author of this essay "Difference between the regression coefficients" comments on the origin of the Chow test.... regexp income Null hypothesis: The regression coefficients do not differ significantly for the two time periods time period 0 and time period 1....
8 Pages (2000 words) Essay

Quantitative method for finance

Since Xt and Yt ­ are two random walk series, regressing Yt on Xt using a simple linear regression should yield a insignificant coefficient of Xt and a very low R-squared reflecting very bad fit.... But if the regression is carried out, it will be found that the coefficient is… This is known as a spurious regression since it implies dependence although the variables are independent of one another.... The problem will go away if the regression is run in first differences, or a lagged value of Y is 2....
4 Pages (1000 words) Essay

Apathy and Depression Signs and Amnestic Mild Cognitive Impairment

Through a multiple regression framework, apathy and depression linked to specific cognitive abilities and functional status as presented in a sample of 90 elderly persons (with mean age 75.... The independent variables were apathy, depression, education, and age, while the dependent variables were unprocessed scores on individual tests.... variables Associated with High Caregiver Stress in Patients with Mild Cognitive Impairment or Alzheimers Disease: Implications for Providers in a Co-Located Memory Assessment Clinic....
2 Pages (500 words) Research Paper

Effectiveness of Insurance Fraud Interventions

More specifically, the paper uses the PRIDIT (Relative to an Identified Distribution Integral Transform) analysis to assign numerical scores on the predictor variables.... Some of the predictor variables used include evaluation of time between incident occurrence and claim filling and age of the claimant....
24 Pages (6000 words) Literature review

Statistical Package for the Social Sciences Program

ariable Type: For using the ANOVA method two variables namely Moves and Range of Movement are used.... This assignment "Statistical Package for the Social Sciences Program" presents the results that we obtained and it is clear that prematurely born infants are different from full-term infants in terms of mother's education, income, and depression level....
14 Pages (3500 words) Assignment
sponsored ads
We use cookies to create the best experience for you. Keep on browsing if you are OK with that, or find out how to manage cookies.
Contact Us