StudentShare
Contact Us
Sign In / Sign Up for FREE
Search
Go to advanced search...
Free

Item Analysis - Assignment Example

Cite this document
Summary
The author of this assignment "Item Analysis" provides statistical data on item analysis. It is mentioned here that the process of item analysis is an ideal candidate for gathering this information. There are a number of ways in which the items on a test may be analyzed…
Download full paper File format: .doc, available for editing
GRAB THE BEST PAPER94% of users find it useful
Item Analysis
Read Text Preview

Extract of sample "Item Analysis"

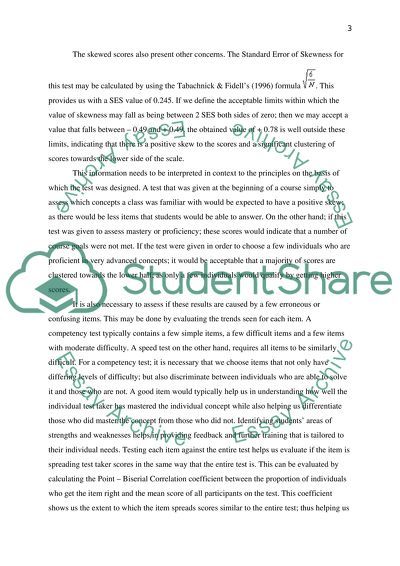
Item Analysis When designing a test, quiz or exam, it is necessary that the chosen items help in certain key areas of assessment by providing valid results. The test should be able to reliably measure the ability of the test takers so that there is a possibility of comparison amongst members of a group on the basis of the scores obtained. A test should also allow us to understand the overall performance of the group; and to form training or further assessment decisions on the basis of the trends seen amongst the scores of test takers. Individual items of a test need to help us discriminate between people who have understood the concept and those who have not; while helping us understand the extent to which basis concepts have been learnt and understood. For this reason; a good test needs to have items that the easy, as well as difficult. The test items should be written in such a manner, as to provide a real challenge to the test taker; while also helping us identify the concepts that need further training and the individuals who may need more attention. The process of item analysis is an ideal candidate for gathering this information. There are a number of ways in which the items on a test may be analyzed for their quality. It is important though; that knowledge of the purpose and subject matter of the test be incorporated into the final analysis. The test at hand has 10 multiple choice items; each with 5 alternatives. Thus, the probability that a test taker could get an answer right by luck is 20%. For the available scores; it may be said that the reliability of the test – measured using the Cronbach’s Alpha Reliability is quite high at 0.84. The Cronbach’s Alpha tells us the extent to which there is consistency in the way a group of test takers have scored on a given test. For this testing session, the test seems to be quite consistent; and the scores may be used as a means of comparison amongst individual test takers. Having said this; there are a few concerns about this test. It is observed that the test scores have a strong positive skew (+0.78) indicating that the majority of the test scores are clustered towards the lower end of the scale. A prominent skew in the scores does affect the efficacy of the calculation of the Alpha coefficient; and this may reduce the value of the test. Also; the Alpha coefficient is affected by the length of the test; with the reliability being higher and more trusted for a longer test than a shorter one. The given test is only 10 items long; and this may compromise the reliability to some extent. The skewed scores also present other concerns. The Standard Error of Skewness for this test may be calculated by using the Tabachnick & Fidell’s (1996) formula . This provides us with a SES value of 0.245. If we define the acceptable limits within which the value of skewness may fall as being between 2 SES both sides of zero; then we may accept a value that falls between – 0.49 and + 0.49. the obtained value of + 0.78 is well outside these limits, indicating that there is a positive skew to the scores and a significant clustering of scores towards the lower side of the scale. This information needs to be interpreted in context to the principles on the basis of which the test was designed. A test that was given at the beginning of a course simply to assess which concepts a class was familiar with would be expected to have a positive skew; as there would be less items that students would be able to answer. On the other hand; if this test was given to assess mastery or proficiency; these scores would indicate that a number of course goals were not met. If the test were given in order to choose a few individuals who are proficient in very advanced concepts; it would be acceptable that a majority of scores are clustered towards the lower half; as only a few individuals would qualify by getting higher scores. It is also necessary to assess if these results are caused by a few erroneous or confusing items. This may be done by evaluating the trends seen for each item. A competency test typically contains a few simple items, a few difficult items and a few items with moderate difficulty. A speed test on the other hand, requires all items to be similarly difficult. For a competency test; it is necessary that we choose items that not only have differing levels of difficulty; but also discriminate between individuals who are able to solve it and those who are not. A good item would typically help us in understanding how well the individual test taker has mastered the individual concept while also helping us differentiate those who did master the concept from those who did not. Identifying students’ areas of strengths and weaknesses helps in providing feedback and further training that is tailored to their individual needs. Testing each item against the entire test helps us evaluate if the item is spreading test taker scores in the same way that the entire test is. This can be evaluated by calculating the Point – Biserial Correlation coefficient between the proportion of individuals who get the item right and the mean score of all participants on the test. This coefficient shows us the extent to which the item spreads scores similar to the entire test; thus helping us discriminate between participants who are doing well and those who are not. A high positive Point – Biserial correlation coefficient means that the item in question does discriminate well; while a high negative correlation coefficient means that an individual doing well on the said item is not doing well on the test as a whole. A low correlation would signify that the item does not discriminate too much amongst test takers. Typically, very easy and very difficult items do not discriminate much. When we look at Item 1, we find that 70% have answered it correctly. The item thus has a moderately high difficulty coefficient of 0.70. This means that the item is a relatively easy one. This item also has a moderate ability to discriminate between test takers; and has a Point – Biserial Correlation coefficient of 0.40; which is significant at the 0.01 level. We see that of the wrong answers, option B and C have rarely been chosen; but option D and E have been chosen by 11% and 12% of test takers respectively. While overall, this should not be a major problem; these distracter choices may need to be modified in language to enhance the discriminative power of the item. With Item 2, we see that it has a difficulty coefficient of 0.68; but the Point – Biserial Correlation coefficient is very low; that is 0.04. This is a non significant relationship; and shows that the item has very low discrimination ability; which may be attributable to the fact that alternative E seems to have been scored by 14% of test takers. This item is reasonably able to evaluate mastery as it is only moderately easy; but is not very good at discriminating between those who do well and those who do not. On evaluating the spread of scores for Item 3, we see that it is a very easy item; with 98% of the test takers having got the answer right. Such an easy item rarely adds value to the test; as it is evident that this particular concept need not be tested further. We also see that distracters A and C are chosen by one person each; but distracters B and E are not chosen by any test takers. One reason why this may have happened is that the item may be written in a way that gives the answer away. This should be checked for before accepting the item into further analysis. As it typically is with very simple items; the item has a zero value Point – Biserial Correlation coefficient; showing that this item does not discriminate between test takers at all. The difficulty coefficient for item 4 is 0.34; which would be acceptable as this means that the item is a relatively difficult one; and only the more proficient of the test takers would get it right. But on closer analysis; we see that the distracter option E has almost as many people choosing it. 34% people chose the option – the right answer while 32% chose option E. The rest were relatively similarly divided between the other three options. This shows that the test takers were very confused between options B and E. This may have happened due ambiguity of the language used or due to the possibility that both options are equally right as responses to the item question. Another cause for concern is that the Point – Biserial Correlation coefficient for this item is a negative one of – 0.19. This correlation coefficient is only just short of the required value to be significant at the 0.05 level. This means that those who did well on this item did not do well on the overall test. Such results lead to the concern that the wrong alternative may be keyed – and option E needs to be looked into closely. The difficulty coefficient for item 5 is 0.64, showing that is again a relatively easy item. When looking at the spread of scores; we see that options A and E have almost 30 % test takers choosing one of them; while option b has not been chosen by anyone. There may be a need to reword these options to make all alternatives equally viable. The Point – Biserial Correlation coefficient is 0.23; showing that the item has a moderate to low discrimination ability. The significant correlation coefficient helps us accept this ability to discriminate between test takers. Item 6 has a difficulty coefficient of 0.54 showing that almost an equal number of test takers got it right as those that got it wrong. But the rest of the scores are concentrated on distracter options C and D; while almost no one has chosen options A and E. This calls for an analysis of the way the items are worded. Another point of concern is that the Point – Biserial Correlation coefficient is also a negative one of – 0.15. Although this relationship is not statistically significant; this does mean that the test takers who did well on this item did not do too well on the test overall. This could point towards improperly worded or ambiguously worded options; so that the option D was chosen by 29 people out of 100. There is a possibility that the item could be answered by test takers who studied in a particular way (like rote learning) but was difficult for others who were more likely to learn by abstracting and assimilating. The Item 7 difficulty coefficient was a moderate 0.57; showing that this item had average difficulty. The Point – Biserial Correlation coefficient was also the highest for this item; and was 0.44; which is quite a significant relationship.. This shows that the item did distinguish well between individuals who got the answer right and those that got it wrong. On the basis of this; it seems to be quite a sound item. But when we look at the spread of scores across the alternative options; it may be noted that only two of the five options were marked by the test takers. While 57% marked the target option C; 43% marked the distracter option B. Options A, D and E were not chosen by anyone. This shows that these options were possibly arbitrary; and could not attract any test taters. They need to be reworded; or the item could be made a dichotomous one. Item 8 was scored right by 100% of test takers; and not a single one got it wrong. The difficulty coefficient was 1.00 and the Point – Biserial Correlation coefficient was 0.00. As expected; this item has no discriminatory value. It is evidently extremely easy; and may need to be replaced or removed from the test altogether. The difficulty coefficient for Item 9 was 0.29; showing that is was quite a difficult item. The spread of test taker choices was found to be quite similar across all options – the target option E was scored by 29 out of a 100 people; options B and D were selected by 21 persons each, and options C and A were scored by 18 and 11 persons respectively. The scores are more or less similar for each option; and this may be due to test takers choosing at random. This can happen if the item is too difficult; or outside of the study material. It is possible that the item may have confused test takers by mixing concepts or wording concepts in such a way that it was not understood by the test takers. The Point – Biserial Correlation coefficient was a marginal, but negative – 0.04. This shows that the item could not discriminate the ones who had the answer right from those who could not. This is expected in a guessing condition. There is a clear need to look into the matter of this item. The last item – Item 10 had a difficulty coefficient of 0.42; showing that it was a slightly difficult item; but on closer examination it was seen that a majority of the test takers (32%) who marked the wrong answer marked the distracter D. The rest of the test takers marked either one of the distracter options E (15%), B (7%) or C (4%). It is necessary to see if this item has been ambiguously worded. The item also has a moderate discrimination index value of 0.34 – a significant correlation – showing that the item did discriminate between those who did well and those who did not to some extent. On the basis of these evaluations; it is seen that there need to be a few changes to the test in order to remove its flaws. Item 8 needs to be removed or replaced; as it has been seen to be too easy for the test group. Item 3 also needs to be assessed for its simplicity and if necessary, should be re-written in order to make the distracter options less arbitrary and more valuable. If found to be similar to item 8; it could also be replaced. Items 5, 6 and 7 have distracter options that are not being chosen at all; and this could be because they are obviously fillers. These should be re-worded; or the format of the questions could be changed if allowed by the subject matter so that the fewer options given do seem on the face of it as real alternatives to each other. Items 1 and 2 also should be checked for their wording of the questions and response options so that and ambiguity is removed. Items 4 and 10 have distracter options that have attracted significant test takers; and should be evaluated for validity. If the distracters are found to be valid answers as well; the response options should be modified such that there is only one right answer. This will not only reduce the ambiguity of the item; but would also help in enhancing the discriminatory value of the item. Item 9 should be carefully examined as it may be outside the test material; or wrongly worded; so that almost everyone needs to guess its answer. It may be necessary to replace this item with another one that is a valid item that does test a concept that is part of the material to be tested. This evaluation should help in enhancing the value of the test; as well as making it a more valid instrument of measuring the performance of the target group. References Brown, J. D. (1996). Testing in language programs. Upper Saddle River, NJ: Prentice Hall. Guilford, J. P., & Fruchter, B. (1973). Fundamental statistics in psychology and education. (5th ed.). New York: McGraw-Hill. Mellenbergh, G.J. (1989). Item bias and item response theory. International Journal of Educational Research. Vol. 13(2), 127--143. Tabachnick, B. G., & Fidell, L. S. (1996). Using multivariate statistics. (3rd ed.). New York: Harper Collins. Read More
Cite this document
  • APA
  • MLA
  • CHICAGO
(“Item Analysis Assignment Example | Topics and Well Written Essays - 1000 words”, n.d.)
Retrieved from https://studentshare.org/statistics/1431388-item-analysis
(Item Analysis Assignment Example | Topics and Well Written Essays - 1000 Words)
https://studentshare.org/statistics/1431388-item-analysis.
“Item Analysis Assignment Example | Topics and Well Written Essays - 1000 Words”, n.d. https://studentshare.org/statistics/1431388-item-analysis.
  • Cited: 0 times

CHECK THESE SAMPLES OF Item Analysis

History of Tests & Measurements

If the processes under study provide various responses after analysis, the tests may be considered reliable in this context.... History of tests and measurements Name Institutional affiliation Tutor Date History of tests and measurements 1.... .... Introduction Tests are the basis in which accuracy, abilities and exactness are measured....
5 Pages (1250 words) Essay

Analyzing And Improving The Appropriateness Of The Exams

To determine these factors, a myriad of assessment methods are used on the exam questions, including basic statistics to determine the performance of the students, qualitative and quantitative Item Analysis.... Qualitative Item Analysis refers to the careful reading of the contents of the exam to determine the accuracy of the exam, find proofreading errors, and determine whether any components of the exam could tip the students towards the correct answer (Triola, 2003)....
5 Pages (1250 words) Term Paper

Development of Personality Tests

item simplicity should be paramount because complex or ambiguous queries tend to confuse the respondent and lead to the generation of responses, which do not convey the targeted characteristic outcome of the research.... item design, in a personality test, is supposed to put the respondent at ease because, in this state, a subject is relaxed enabling a clear and conscious interpretation of issues that come to their direction....
8 Pages (2000 words) Essay

Research Methods for Business by Uma Sekaran

The following book report "Research Methods for Business by Uma Sekaran" is focused on the processes of a research method in relation to business.... It is stated that the problem at hand, involves students of New Brunswick College who are studying hotel and restaurant operation.... nbsp;… The students from New Brunswick College are managing and operating a restaurant where the tips received are given to the school....
9 Pages (2250 words) Book Report/Review

Quantitative Nursing Analysis

This paper "Quantitative Nursing analysis" contains  analysis of a study done to determine factors related to critical thinking skills and critical thinking dispositions using the sample consisted of nursing students enrolled in a baccalaureate degree program....
9 Pages (2250 words) Research Paper

Human Resource Policies to Enhance Organisations Performance

The paper "Human Resource Policies to Enhance Organisations Performance" analyzes the diverse and current HR practices that are popular (through literature survey) and also, to interact first-hand with HR managers in organizations selected for carrying out the interviews.... hellip; Human Resource is the central resource of any organization, and when an organization recruits its employees, it not only hires their hands or skills but the entire person as a whole....
7 Pages (1750 words) Research Paper

Item Analysis and Marks

There are two types of Item Analysis: qualitative and quantitative Item Analysis.... Qualitative Item Analysis procedures include the careful proofreading of the exam to… Qualitative Item Analysis includes a thorough analysis that uses three numerical indicators: item difficulty, item discrimination and distractor power Item Analysis and Marks Item Analysis refers to a group of procedures that are used in the assessment of the quality of exam items....
2 Pages (500 words) Assignment

Item Reliability Entire assignment desciption sent for reference

eliability and Item Analysis.... om/textbook/reliability-and-item-analysis/Trochim, W.... Stimuli presented were either positive or… The researchers listed labored breathing, sweating and micro-facial expressions such as twitching at the corner of the eye, pursing lips, furrowing eyebrows, crying, smiling as the categories of physiological and item Reliability Testing scenario In this testing scenario, three observers proceeded with the task of observing participants involved in an experiment aimed at investigating participants' physiological and emotional reactions towards exposure to selected stimuli....
2 Pages (500 words) Term Paper
sponsored ads
We use cookies to create the best experience for you. Keep on browsing if you are OK with that, or find out how to manage cookies.
Contact Us