StudentShare
Contact Us
Sign In / Sign Up for FREE
Search
Go to advanced search...
Free

Multiple regression - Term Paper Example

Cite this document
Summary
Executive Summary Multiple regression is an effective technique to identify a relationship between one dependent variable and multiple independent variables. It is hypothesized the property crime rates per thousand inhabitants is dependent on multiple factors such as per capita income, school dropout percentage, population density, percentage of people living in urban area and so on…
Download full paper File format: .doc, available for editing
GRAB THE BEST PAPER94.9% of users find it useful
Multiple regression
Read Text Preview

Extract of sample "Multiple regression"

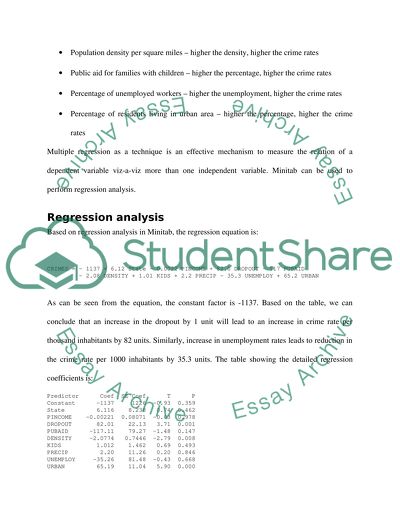
?Executive Summary Multiple regression is an effective technique to identify a relationship between one dependent variable and multiple independent variables. It is hypothesized the property crime rates per thousand inhabitants is dependent on multiple factors such as per capita income, school dropout percentage, population density, percentage of people living in urban area and so on. In order to establish a certain relationship between the variables, multiple regression was used. While crimes is the dependent variable, other variables such as state, per capita income, dropouts, average precipitation, public aid recipients, population density, unemployment, percentage of people living in urban areas were considered as independent variable. Minitab was used to perform multiple regression analysis. It was found that only two variables had a significant relationship with the variable crime rates: dropouts and urban. It was found that as percentage of dropouts increased, the crime rate per thousand inhabitants also increased. It is also evident from the data set that urban areas are having higher crime rates as compared to rural areas. Other variables included in the study did not have much impact on the dependent variable. Introduction Property crimes in an area can be thought of function of many factors. Some of these factors along with hypothesized direction of the relation are: State – different states will have different property crimes Per capita income – higher the per capita income, lower the crime rates Dropouts from high school – higher the dropouts, higher the crime rates Average precipitation in inches – higher the precipitation, lower the crime rates Percentage of public aid recipients – higher the percentage, lower the crime rates Population density per square miles – higher the density, higher the crime rates Public aid for families with children – higher the percentage, higher the crime rates Percentage of unemployed workers – higher the unemployment, higher the crime rates Percentage of residents living in urban area – higher the percentage, higher the crime rates Multiple regression as a technique is an effective mechanism to measure the relation of a dependent variable viz-a-viz more than one independent variable. Minitab can be used to perform regression analysis. Regression analysis Based on regression analysis in Minitab, the regression equation is: CRIMES = - 1137 + 6.12 State - 0.0022 PINCOME + 82.0 DROPOUT - 117 PUBAID - 2.08 DENSITY + 1.01 KIDS + 2.2 PRECIP - 35.3 UNEMPLOY + 65.2 URBAN As can be seen from the equation, the constant factor is -1137. Based on the table, we can conclude that an increase in the dropout by 1 unit will lead to an increase in crime rate per thousand inhabitants by 82 units. Similarly, increase in unemployment rates leads to reduction in the crime rate per 1000 inhabitants by 35.3 units. The table showing the detailed regression coefficients is: Predictor Coef SE Coef T P Constant -1137 1226 -0.93 0.359 State 6.116 8.238 0.74 0.462 PINCOME -0.00221 0.08071 -0.03 0.978 DROPOUT 82.01 22.13 3.71 0.001 PUBAID -117.11 79.27 -1.48 0.147 DENSITY -2.0774 0.7446 -2.79 0.008 KIDS 1.012 1.462 0.69 0.493 PRECIP 2.20 11.26 0.20 0.846 UNEMPLOY -35.26 81.48 -0.43 0.668 URBAN 65.19 11.04 5.90 0.000 The first column of the table below shows the regression coefficient of all the independent variables. The second column contains the standard error of the regression coefficient. The standard error of all the variables is the distance of the standard value from its true value. As can be seen from the table, the standard error of the constant term (intercept) is 1226 while it is 8.238 for the variable state. The third column is the calculated t-value for the data. This can be used to test that the corresponding population coefficient is 0. The probability that the population value for the corresponding variable is 0 is given in the last column. A row with small p-values and high t-values suggests that the variable is significant and contributes to the model. From the table, it can be seen that, State, dropout and urban are the two most significant variables that determine the crime rates. The value set for S, r2 and adj r2 for the model developed by multiple regression is: S = 753.530 R-Sq = 69.5% R-Sq(adj) = 62.6% The S value of 753.530 is an indication of the distance of the actual points from the model that has arisen out of the regression equation. r2 and adjusted r2 indicate the coefficient of determination. The coefficient of determination is an indication of the effectiveness of the model in predicting future outcomes. This implies that the model developed by us will be suitable to forecast future value of crime rates per thousand inhabitants in 69.5% of the cases. Adjusted r2, which is a modified value of r2 adjusts for the number of explanatory terms in a model. Hence it is always less than or equal to r2. The table below shows the Analysis of variance: Source DF SS MS F P Regression 9 51654105 5739345 10.11 0.000 Residual Error 40 22712294 567807 Total 49 74366399 We can see from the table above, the F value is 10.11 and degrees of freedom are 9 and 40. The p-value for the analysis here is 0.000. This indicates that at least one of the independent variables contributes something to the regression equation. Based on the multiple regression analysis, we see that the intercept and variables dropouts and urban are the most significant. Rerunning the regression analysis keeping only these variables as the independent factor, we find the following as the regression equation: CRIMES = - 334 + 55.5 DROPOUT + 53.2 URBAN As can be seen, crimes per thousand inhabitants increase with increase in dropouts from the colleges. From the equation above, with high school dropout percentage at 0 and 0% of the population living in urban area, there will be a negative crime rate of -334. With each percentage increase in the dropout percentage, the crimes per thousand inhabitants increase by 55.5. At the same time, crimes are more in urban areas as compared to rural areas. The table below shows the table for regression analysis: Predictor Coef SE Coef T P Constant -333.9 653.3 -0.51 0.612 DROPOUT 55.46 17.21 3.22 0.002 URBAN 53.226 8.316 6.40 0.000 As can be seen from the t-value and p-value, both variables dropout as well as urban are significant in predicting crimes per thousand inhabitants. The line below is the calculation of S and coefficient of determination: S = 838.720 R-Sq = 55.5% R-Sq(adj) = 53.6% From the values, it is evident that the model developed above can be used to predict the crime rates in 55.5% of the cases. Moreover, the points in the actual scenario are away from the model by a unit of 838.720. The table below shoes the analysis of variance for the two independent variables: dropout and urban Source DF SS MS F P Regression 2 41304218 20652109 29.36 0.000 Residual Error 47 33062181 703451 Total 49 74366399 F value from the calculation is 29.36 with a degree of freedom of 2 and 47. The small value of p indicates that at least one of the independent variable is having a significant impact on the dependent variable crimes per thousand inhabitants. The scatter plot between two variables is an efficient tool to measure the relationship between them. The graph below shows the scatter plot diagram for dependent variable crimes with respect to dropout percentage and urban population on the x-axis respectively: As can be seen from the graphs above, most of the points are near to the regression line. However, the percentage of points near to the regression line is more in case of the variable urban as compared to the variable dropouts. From the scatterplot, it is evident that the relationship between the dependent and independent variables are positive in nature. The graph below shows the normal probability plot of the residuals for the two significant variables: We see that the residuals are very close to the line. This implies that the residuals are normally distributed. This can be validated from the histogram of the residuals below: Conclusion Based on the multiple regression analysis, we find that the crime rate per thousand inhabitants is dependent on multiple variables such as dropout percentage, population density, and percentage of population living in urban areas. As the dropout percentage increase, the crime rate per thousand inhabitants increases. At the same time, crime rates are higher for urban areas as compared to rural areas. References Levin, R.I., & Rubin, D.S. (2007). Statistics for Management, 7th ed. New Delhi: Pearson prentice Hall. Read More
Cite this document
  • APA
  • MLA
  • CHICAGO
(“Multiple regression Term Paper Example | Topics and Well Written Essays - 1500 words”, n.d.)
Retrieved from https://studentshare.org/statistics/1430767-multiple-regression
(Multiple Regression Term Paper Example | Topics and Well Written Essays - 1500 Words)
https://studentshare.org/statistics/1430767-multiple-regression.
“Multiple Regression Term Paper Example | Topics and Well Written Essays - 1500 Words”, n.d. https://studentshare.org/statistics/1430767-multiple-regression.
  • Cited: 0 times

CHECK THESE SAMPLES OF Multiple regression

Multiple regression model

Name: Course: Professor: Date: Title: MUTIPLE regression MODEL Introduction Just like in a normal market situation, housing market also experience the forces of demand and supply.... A regression model will be developed: that will eventually be used to project the level of house prices in the future....
7 Pages (1750 words) Essay

Statistics 401 Mod 5 Case - Multiple Regression Analysis

Multiple regression Name Institution Below is the Regression analysis and results of the data.... 26 Multiple regression analysis is a data analysis procedure which is used to establish the relationship between a given variable and a set of other two variables.... In the case of Multiple regression analysis, the independent variables are more than one.... ? We computed a Multiple regression equation using these variables, with starts as the DV....
4 Pages (1000 words) Coursework

Multiple Regressions Empirical Project

To make this a success, secondary data downloadable from http://www.... swego.... du/~kane/econometrics was used.... From the results it was found out that a billion… Further, a billion dollar increase in direct foreign investment holding consumption and net exports constant leads to 0.... 8 billion dollar decrease in A billion dollar increase in net exports holding consumption and direct foreign investments constant leads to 0....
6 Pages (1500 words) Essay

Multiple Regression and Correlation Techniques

An example of the source of the Multiple regression and correlation techniques The aimed at addressing controversies and developing innovations in research.... Multiple regression and correlation techniques: Recent controversies and best practices.... Some of the identified controversies regard linking theory to hypothesis and testing of mediator or moderator variables....
1 Pages (250 words) Assignment

Multiple regression exercise

In this study we intended to establish the relationship between the value of Qatar's exports in the oil and gas sector and the size of Qatar's economy (as measured by GDP), the size of the economy of the importing country (as measured by GDP) and the distance between Qatar… To determine the relationship, we conducted a Multiple regression test and the results are shown in the preceding sections below; The above table gives the summary statistics from the regression output....
2 Pages (500 words) Coursework

Multiple Regression Analysis: Empirical Project

This study "Multiple regression Analysis: Empirical Project" is meant to determine the impact of increasing consumption expenditures, investments, disposable income and exports on the GDP growth.... urther, simple regression models of the nature GDP = β0 + β1ya (where you are the IV) were estimated....
8 Pages (2000 words) Essay

Multiple Regression Model for US GDP

"Multiple regression Model for US GDP" paper contains a discussion on how Multiple regression models can be used to estimate the relationship between GDP, consumer, government spending, and wars.... A simple regression estimates the relationship between two variables whereas Multiple regression models are used in estimating relationships amongst more than two variables.... Amongst the many tools and techniques is the regression analysis....
14 Pages (3500 words) Coursework

SPSS Correlation Analysis and Multiple Regression

The study "SPSS Correlation Analysis and Multiple regression" focuses on the complex correlation analysis and Multiple regression of the SPSS.... Forwards Backwards and Stepwise) for fitting regression models involving more than one predictor variable.... Stepwise linear regression is a method used to regress multiple variables while simultaneously removing those that aren't important; forward refers to adding one variable at a time while backward refers to removing one variable at a time....
6 Pages (1500 words) Case Study
sponsored ads
We use cookies to create the best experience for you. Keep on browsing if you are OK with that, or find out how to manage cookies.
Contact Us