StudentShare
Contact Us
Sign In / Sign Up for FREE
Search
Go to advanced search...
Free

Disparity in the Salaries Earned by Men and Women - Research Paper Example

Cite this document
Summary
"Disparity in the Salaries Earned by Men and Women" paper analyses the data in a statistical package called Minitab, which is designed to ‘make data analysis easier. Descriptive statistics were used to provide summaries of the information, which made it simple to evaluate different types of data.  …
Download full paper File format: .doc, available for editing
GRAB THE BEST PAPER94% of users find it useful
Disparity in the Salaries Earned by Men and Women
Read Text Preview

Extract of sample "Disparity in the Salaries Earned by Men and Women"

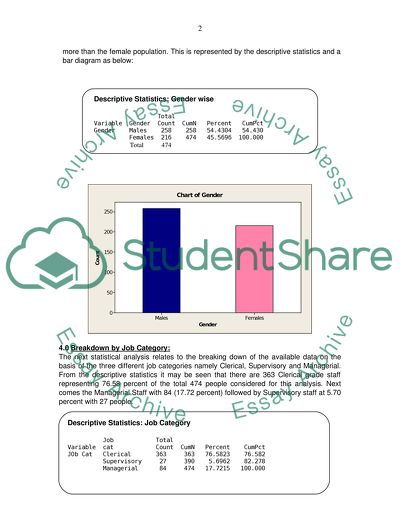
1.0 Introduction: There has always been a disparity in the salaries earned by men and women. Although the work done remains the same, men claim higher wages than their women counterparts. This phenomenon appears to be universally true irrespective of the status of the country in respect of its industrial advancement. The presented data give some results from a government survey in the USA relating to salaries for 474 people. The analysis of the data with the help of Minitab presents the following results which provide a very interesting example of what has been stated above in respect of gender diversity. This paper details the data analysis in various forms. 2.0 Methodology: The provided data was analysed using a statistical package called Minitab (version 15), which is designed to 'make data analysis easier'. Descriptive statistics were used to provide summaries of the information, which made it simple to examine and evaluate different types of data. Basic Statistical features along with graphical presentation along with graphical presentation features of Minitab were used to represent the data in a meaningful and easily understandable way. For example, it would easier to analyse the male and female representation, job category wise as provided by the data using the Bar Charts. This enables the reader to catch the precise representation of the different groups on a look just at the chart without really looking at the numbers. 3.0 Gender Diversity: This is the very basic analysis of breaking down the total data into the number of males and females for whom the salary data is presented. Out of the total number of 474 people, whose salaries are analysed there are 258 males and 216 females whose salaries have been considered. The males represent 54.43 percent and females represent 45.57 percent of the sample selected. The pie diagram and the descriptive statistics representing the date are as below: From the above pie diagram it is easier to understand the proportion of both genders in the total sample data. Obviously as represented by the numbers the male population is more than the female population. This is represented by the descriptive statistics and a bar diagram as below: 4.0 Breakdown by Job Category: The next statistical analysis relates to the breaking down of the available data on the basis of the three different job categories namely Clerical, Supervisory and Managerial. From the descriptive statistics it may be seen that there are 363 Clerical grade staff representing 76.58 percent of the total 474 people considered for this analysis. Next comes the Managerial Staff with 84 (17.72 percent) followed by Supervisory staff at 5.70 percent with 27 people. The above data can be represented diagrammatically as below: A further breakdown of the data led us to the following distribution of job category wise people in the male staff. There are 157 Clerical staff, 27 supervisory staff and 74 managerial staff in the males segment of the sample population. The respective percentages are 60.85, 10.47 and 28.68. The pictorial representation is also presented below: A similar analysis in respect of the female staff shows the following representation. It may be observed that there is no supervisory staff from the female segment. The total of 27 supervisory staff is being represented only by males. Another significant factor is the number of clerical staff is more at 206 as compared to the men at 157. The diagrammatic representation is as below: A comparative descriptive statistics and a diagrammatic representation are produced below. It may be observed that the pictorial representation with the male and female components of the job category wise representation presents a meaningful analysis to the reader of the data. Especially in the case of supervisory staff where there is no representation from female segment is presented diagrammatically on a better way. Similarly the more number of female clerical workers than the males is also represented much better diagrammatically than presented by way of tables and figures; so also the less number of managerial staff from females 5.0 Distribution of Current Salaries: The Current Salaries range from $ 16,950 to $ 135,000 with a maximum of 127 people receiving a salary in the range of $ 22,500 to $ 27,500. The minimum current salary is $16,950 in the case of females; and $ 30,750 in the case of males (See Appendix) The Mean value for the distribution of the current salaries for the 474 people is $ 34420. This figure represents the total current salary for all the 474 people divided by the number of people representing the average salary for the distribution. The Standard Deviation measures how spread the current salaries are with respect to the mean salary. i.e. how much the salary figures vary from one another. It may be seen that only very few people are in salary ranges higher than $ 45,000The histogram representing the distribution of current salaries is appended below: Descriptive Statistics: current salary Variable Mean Median current salary 34420 28875 The histogram seems to be symmetrical according to the blue distribution curve. When this is the case (bell-shaped) the mean=median=mode. Although the mean is greater than the median, suggesting a positively skewed distribution, the difference is not huge and it can be safely mentioned that there is a symmetrical distribution. Descriptive Statistics: current salary N for Variable Mode Mode Current salary 30750 13 The 'Mode' of the distribution is represented by the current salary of $ 30,750 which implies that the $ 30,750 is the current salary which most number of people are receiving and the number of people receiving this salary is 13. 6.0 Distribution of Current Salaries by Ethnicity: The distribution centers round two segments of staff namely non-ethnic minority and ethnic minority. From the distribution it can be observed that the current salaries for the ethnic minorities are at lower levels than those of the non-ethnic minorities. The higher range of salaries is being received by the non-ethnic minority people. 7.0 Relationship of Current Salary to Starting Salary: The Descriptive statistics showing the relationship between Current salary and Starting Salary is exhibited in the Appendix. From the analysis it is observed that in respect of males the starting salary of $ 9,000 has reached a minimum current salary of $ 30,750 and in the case of females the starting salary of $ 9,000 has reached a minimum current salary of $ 16,750 and a maximum of current salary of $21,150. Similarly on the highest starting salary of $ 79,980 has reached a current salary of $ 135,000 in the case of males and the highest starting salary of $ 30,000 in the case of females has reached the current salary of $ 56,750. It may be seen that the range of increase from the starting salary to the current salary is more in the case of male employees. It may also be observed from the graphical representation that the at the higher range starting salaries the number of cases where increments have happened is much less as compared to that at the lower range of salaries. This phenomenon is aptly represented by the scatter diagrams the relationship between starting salaries and current salaries in respect of male and females shown separately. The relevant diagrammatic representations are appended below: 7.0 Conclusion: From the foregoing analysis of the presented data the following conclusions arise: The proportion of male to female staff is more The female clerical staff is more in number than the males There is no female supervisory staff The range of increments from the starting salaries to the current salaries is more in respect of males The salary distribution in respect of the sample population is very wide in that only 13 people receive the same salary. The people receiving higher current salaries are less in number. The higher range of salaries is being received by non-ethnic minority people as compared to ethnic minority. Introduction: For Completing Task 2 the Current Earnings of the US sample population and the Earnings for the year 2006 for male and female workers in UK has been taken for analysis. Methodology: To make the figures comparable, the mean and median for three groups of data on current earnings for both USA and UK have been calculated. The three groups are All workers together, males only and females only. The data have been compared as below: Mean Earnings for Males and Females - USA and UK Mean and Median Earnings - USA and UK for ALL Mean and Median Earnings - USA and UK for MALES Mean and Median Earnings - USA and UK for FEMALES The results and diagrammatic representations are appended below: Descriptive Statistics: All - Current salary Variable Mean Median current salary 34420 28875 Descriptive Statistics: Male and Female - Current salary Variable Gender Mean Median current salary Males 41442 32850 Females 26032 24300 Amount in US $ Details Mean (USA) Mean (UK) Median (USA) Median (UK) All 34420 47649 28875 38228 Males 41442 60175 32850 47846 Females 26032 34820 24300 28553 The Current Earnings figures are sourced from 2006 Annual Survey of Hours and Earnings (ASHE) Analysis by All Employees Table No. 1.7a Annual Pay - Gross from website: Earnings in Pounds have been converted into US Dollars at 1 = $ 1.96081 http://www.statistics.gov.uk/downloads/theme_labour/ASHE_2006/2006_all_employees.pdf Figure 1: It can be seen that the difference between the mean income for Males and Females is more in UK than in USA. Another point that can be observed is the mean income for both males and females is less in USA as compared to UK. Figure 2: Figure 2 represents the Mean and Median income distribution for both categories of workers and it is evident from the graph that the income levels are more in the UK as compared to USA. Figure 3: The Income distribution represented by Mean and Median levels for males also points out the fact that the mean income for males in UK is more than that of USA. Although the difference is less still the median income for UK is higher than that of the USA. Figure 4: Figure 4 represents the Mean and Median Income distribution in respect of female workers in USA and UK. It may be observed that the difference in the median income is less as compared to the mean income in the case of females. Appendix Descriptive Statistics: Males - Relation ship Between Start Salary and Current Salary start salary Minimum Maximum 9000 30750 30750 9750 22500 22500 11400 25500 25500 11550 21300 27750 12000 28350 28350 12600 31050 31050 12750 19650 26700 13050 25200 25200 13500 23700 35250 14100 24150 33450 14250 23250 46000 14400 25500 25500 14550 21900 21900 14700 27450 27450 15000 22050 45150 15600 26250 26250 15750 21300 80000 16050 26250 26250 16500 22500 40350 17100 25950 25950 17250 25950 40200 17490 33300 33300 18000 27000 35700 18750 36000 40200 19500 29340 52650 20250 34950 41100 20400 37500 37500 20550 49000 49000 21000 40200 56500 21240 44875 47250 21480 45250 45250 21750 48000 83750 21990 48750 48750 22500 60625 60625 23250 43950 45625 23730 38700 60000 25000 56550 56550 25500 40050 54900 26250 42300 73750 27000 57000 57000 27480 51250 78250 27510 68750 103750 27750 34620 34620 28740 61875 78500 29490 91250 91250 30000 59375 81250 30750 65000 65000 31250 90625 90625 31500 75000 75000 31980 65000 66875 32010 68125 68125 32490 50000 68125 33000 47550 73500 33750 55500 59400 34980 55000 82500 35010 97000 97000 35040 70000 70000 36240 51450 51450 36750 61875 61875 37500 65000 65000 39990 92000 92000 42480 69250 69250 42510 75000 75000 43500 70875 70875 44100 100000 100000 45000 86250 110625 47490 66000 66000 52500 66750 66750 60000 103500 103500 79980 135000 135000 Descriptive Statistics: Females - Relationship between Start Salary and Current Salary start Variable salary Minimum Maximum current salary 9000 16950 21150 9750 16200 21900 10050 24600 24600 10200 15750 27450 10500 18750 28500 10650 23700 23700 10950 18150 26250 11100 19200 31350 11225 27750 27750 11250 19650 31350 11400 27600 27600 11550 21000 29250 12000 20850 33900 12150 34500 34500 12300 22950 22950 12450 21750 30600 12750 21450 29100 12900 26700 26700 13050 19650 26550 13200 20100 24450 13350 35550 35550 13500 20850 33300 13800 22200 24000 13950 19650 28800 14100 25200 25200 14250 20700 31650 14400 25200 25200 14550 34800 34800 15000 24300 38850 15300 23400 29400 15750 23250 37800 16500 22200 38550 16800 35100 35100 17250 34500 46875 17490 43000 43000 18000 32550 58125 18750 25200 54375 19500 27750 43500 19980 36000 55750 24990 41550 41550 30000 56750 56750 Read More
Cite this document
  • APA
  • MLA
  • CHICAGO
(“Gender Diversity Research Paper Example | Topics and Well Written Essays - 2000 words”, n.d.)
Gender Diversity Research Paper Example | Topics and Well Written Essays - 2000 words. Retrieved from https://studentshare.org/sociology/1508498-gender-diversity
(Gender Diversity Research Paper Example | Topics and Well Written Essays - 2000 Words)
Gender Diversity Research Paper Example | Topics and Well Written Essays - 2000 Words. https://studentshare.org/sociology/1508498-gender-diversity.
“Gender Diversity Research Paper Example | Topics and Well Written Essays - 2000 Words”, n.d. https://studentshare.org/sociology/1508498-gender-diversity.
  • Cited: 0 times

CHECK THESE SAMPLES OF Disparity in the Salaries Earned by Men and Women

Pay Gap between Men and Women

This paper ''Pay Gap between men and women'' tells us that money is of critical importance in life.... It is due to the utmost importance of money that both men and women do a lot of effort to earn it.... The talent of women is one of the most influencing factors regarding the difference in the pay gap between men and women.... The less confidence of women is one of the most critical elements behind the pay differences, which exists between men and women....
12 Pages (3000 words) Research Paper

Is a woman's earning potential equal to that of a man

Many factors affect the earnings that individuals make,including level of education,gender,race, social backgrounds,and occupational differencesIn studies to disentangle discrepancies in annual incomes between men and women,a significant portion of the difference remains unexplainable and highly controversial.... In studies to disentangle discrepancies in annual incomes between men and women, a significant portion of the difference remains unexplainable and highly controversial....
7 Pages (1750 words) Research Paper

Naomi Barkos perspective of the wage gap due to gender differences

(Barko 1) Even after 5 decades since the enforcement of the Equal Payment Act of 1963, American women earned 74 cents for every dollar earned by men, according to the study published jointly by the AFL-CIO and The Institute for Women's Policy Research (IWPR), Washington (Barko 1).... ?Men's earning in 2011 were $48,202 and women's were $37,118, a difference of $11,084.... Women care takers and cleaners has a salary widely disparate form that of men and all because of gender difference....
6 Pages (1500 words) Essay

The Problems Of The Women In Current World

However, there is a great myth surrounding the cause of the pay gap between men and women.... (Barko 1)Even after 5 decades since the enforcement of the Equal Payment Act of 1963, American women earned 74 cents for every dollar earned by men, according to the study published jointly by the AFL-CIO and The Institute for Women's Policy Research (IWPR), Washington (Barko 1).... Women caretakers and cleaners have a salary widely disparate from that of men and all because of gender difference....
8 Pages (2000 words) Essay

The Causes of the Wage Gap between Men and Women in the United States

The author of the paper "The Causes of the Wage Gap between men and women in the United States" will begin with the statement that President Obama recently signed executive actions seeking to close the gender wage gap, which favors men over women in the country's employment environment.... Irrespective of the varying nature of the statistics, the irrefutable fact is that there is significant inequality between men and women in terms of wage allotment.... auses of the Wage Gap between men and women in the United StatesVarious approaches have been utilized by researchers to determine causative factors of the gender wage gap....
10 Pages (2500 words) Research Paper

The Impact of Education of Disadvantaged Women and Children on Economic Development

This work called "The Impact of Education of Disadvantaged women and Children on Economic Development" describes the effects of women's and girls' education in the overall scheme of economic development.... The author outlines the economic development in different regions of the world....
7 Pages (1750 words) Report

Salary Inequality in the Workplace: Why do Men still Earn More

Whatever the genuine explanation, there is clearly a disparity between earnings with men and women.... Thus, when men and women enter the workforce, men who receive complimentary benefits are assumed to have a better knowledge base associated with technology usage, giving them a salary advantage (Allyn 2003).... If so, one could easily blame the administration in today's colleges and universities for not creating a diverse curriculum that provides men and women with the same quality learning outcomes....
5 Pages (1250 words) Literature review

Role of Gender in the Promotion in Organizations

Despite all the progress and development, the corporations still have not changed to enable women to reach top-level positions.... Although there are some cases where women have reached the top-level of their organizations, their ratio compared to men remains largely insignificant.... The report on the Progress of the World's women 2002 stated that women still make a mere 5% of the heads of big corporations and top-level ranks in international corporations (Vinnicombe, 2007: 17)....
8 Pages (2000 words) Essay
sponsored ads
We use cookies to create the best experience for you. Keep on browsing if you are OK with that, or find out how to manage cookies.
Contact Us