StudentShare
Contact Us
Sign In / Sign Up for FREE
Search
Go to advanced search...
Free

Statistics Coursework - Research Paper Example

Cite this document
Summary
This paper 'Statistics Coursework' tells us that in statistics, it is possible to have summary statistics to denote the nature of a data set. These summary statistics we can have a more precise nature of the data than we can have from data and graphs. These numbers can help us to make quicker and better decisions…
Download full paper File format: .doc, available for editing
GRAB THE BEST PAPER98.7% of users find it useful
Statistics Coursework
Read Text Preview

Extract of sample "Statistics Coursework"

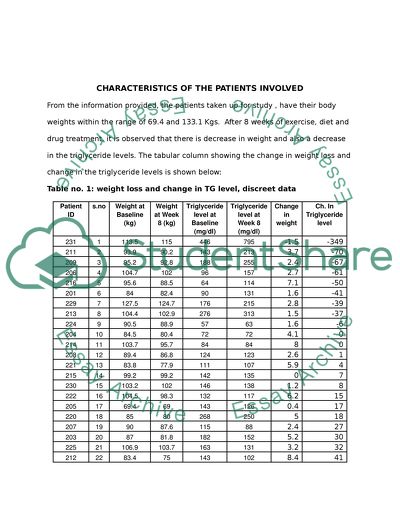
INTRODUCTION In statistics, it is possible to have summary statistics to de the nature of a data set. These summary statistics we can have a more precise nature of the data than we can have from data and graphs. These numbers can help us to make quicker and better decisions, because with these summary statistics, we don't have to refer to the original data set every time. For the study of the relationship between weight loss and change in Triglyceride(hereafter, TG) level, we can calculate the summary statistics, such as the measures of central tendency and measures of dispersion. For the prediction of changes in TG level with change in weight we can also use, correlation and regressions analysis. Hence, this study of the two variables uses various statistical techniques to clearly understand the relationship, which are presented in the following pages. CHARACTERISTICS OF THE PATIENTS INVOLVED From the information provided, the patients taken up for study , have their body weights within the range of 69.4 and 133.1 Kgs. After 8 weeks of exercise, diet and drug treatment, it is observed that there is decrease in weight and also a decrease in the triglyceride levels. The tabular column showing the change in weight loss and change in the triglyceride levels is shown below: Table no. 1: weight loss and change in TG level, discreet data Patient ID s.no Weight at Baseline (kg) Weight at Week 8 (kg) Triglyceride level at Baseline (mg/dl) Triglyceride level at Week 8 (mg/dl) Change in weight Ch. In Triglyceride level 231 1 113.5 115 446 795 -1.5 -349 211 2 93.9 90.2 143 213 3.7 -70 209 3 95.2 92.8 188 255 2.4 -67 206 4 104.7 102 96 157 2.7 -61 216 5 95.6 88.5 64 114 7.1 -50 201 6 84 82.4 90 131 1.6 -41 229 7 127.5 124.7 176 215 2.8 -39 213 8 104.4 102.9 276 313 1.5 -37 224 9 90.5 88.9 57 63 1.6 -6 204 10 84.5 80.4 72 72 4.1 0 214 11 103.7 95.7 84 84 8 0 208 12 89.4 86.8 124 123 2.6 1 221 13 83.8 77.9 111 107 5.9 4 215 14 99.2 99.2 142 135 0 7 230 15 103.2 102 146 138 1.2 8 222 16 104.5 98.3 132 117 6.2 15 205 17 69.4 69 143 126 0.4 17 220 18 85 80 268 250 5 18 207 19 90 87.6 115 88 2.4 27 203 20 87 81.8 182 152 5.2 30 225 21 106.9 103.7 163 131 3.2 32 212 22 83.4 75 143 102 8.4 41 234 23 114.9 105.3 187 144 9.6 43 233 24 106 103.5 255 204 2.5 51 202 25 88.8 87 137 82 1.8 55 219 26 133.1 130.8 212 156 2.3 56 226 27 81.5 78.9 111 54 2.6 57 235 28 103.4 96 154 96 7.4 58 227 29 96.5 94.9 300 241 1.6 59 228 30 103 97.2 192 124 5.8 68 223 31 76.8 73.2 165 96 3.6 69 217 32 126 123.2 226 152 2.8 74 218 33 103.7 95.5 199 120 8.2 79 210 34 108.1 100.9 167 87 7.2 80 232 35 107 99.2 232 63 7.8 169 Table no. 2: Weight loss and change in TG level, continuous data. class for weight loss frequency class for change in TG level frequency -1.9_-1.0 1 -349_-305 1 -0.9_0 1 -304_-260 0 0.1_1.0 1 -259_-215 0 1.1_2.0 6 -214_-170 0 2.1_3.0 9 Weight loss modal class -169_-125 0 3.1_4.0 3 -124_-80 0 4.1_5.0 2 -79_-35 7 5.1_6.0 3 -34_10 7 6.1_7.0 1 Change in TG level modal class 11_55 10 7.1_8.0 5 56_100 9 8.1_9.0 2 101_145 0 9.1_10.0 1 146_190 1 The analysis of discreet data from table No. 1, we can calculate the mean, median and mode. The mean weight loss of the 35 patients is 3.93 and the change in TG level is 11.37. The median analysis, shows that 2.8 is the median for change in weight loss and 18 is the median for change in TG level. 2.1 - 3 kgs is the modal class for change in weight and 11- 55 is the modal class for change in TG level, as we have the maximum number of patients in this class. When we want to calculate the mean, median and mode for continuous data, the data from table 2 has to further arranged as follows: class (grouped data) weight loss(x) frequency(f) cumulative frequency f * x class (grouped data) change in TG level(x) frequency(f) cumulative frequency f * x -1.9_-1.0 -1.5 1 1 -1.5 -349_-305 -327 1 1 -327 -0.9_0 -0.5 1 2 -0.5 -304_-260 -282 0 1 0 0.1_1.0 0.5 1 3 0.5 -259_-215 -237 0 1 0 1.1_2.0 1.5 6 9 9 -214_-170 -192 0 1 0 2.1_3.0 2.5 9 18 22.5 -169_-125 -147 0 1 0 3.1_4.0 3.5 3 21 10.5 -124_-80 -102 0 1 0 4.1_5.0 4.5 2 23 9 -79_-35 -57 7 8 -399 5.1_6.0 5.5 3 26 16.5 -34_10 -12 7 15 -84 6.1_7.0 6.5 1 27 6.5 11_55 33 10 25 330 7.1_8.0 7.5 5 32 37.5 56_100 78 9 34 702 8.1_9.0 8.5 2 34 17 101_145 123 0 34 0 9.1_10.0 9.5 1 35 9.5 146_190 168 1 35 168 TOTAL 35 136.5 35 390 The formula used for calculating the mean, median and mode of grouped data is as follows: Mean , X = (f * x) / n and the answer is 3.9 for the change in weight level and 11.14 for change in TG level Median = (n + 1)/ 2 = 18th item , to calculate it more exact, we can use the formula, m = [{(n + 1)/ 2 - (F + 1)}/ fm] w + Lm, where m = sample median n = total number of items in the distribution = 35 F = sum of all the class frequencies upto, But not including the median class = 9 fm = frequency of the median class = 9 w = class interval width = 1 Lm = lower limit of the median class interval = 2.1 Hence. Median = [ {(35 +1)/ 2 - (9 + 1)}/ 9] x 1 + 2.1 = (16.88/ 9) x 1 + 2.1 Median for weight loss = 2.988 , this means that most number of patients have lost 2.988 Kgs over a period of 8 weeks. Similarly, for the change in TG level, the median is 19.8 To calculate the mode, then the formula is Mo = LMo + {d1 / d1 + d2 } w, where LMo = lower limit of the modal class = 2.1 d1 = frequency of the modal class-the frequency of the class directly below it = 9 - 3 = 6 d2 = frequency of the modal class-the frequency of the class directly above it = 9 - 6 = 3 w = width of the modal class interval = 1 Mode = 2.1 + {6 / 9} 1 = 2.76 for weight loss and similarly we can calculate the mode for change in TG level we get an answer of 22. The graph showing the frequency and cumulative frequency of the continuous data with respect to change in weight loss and change in TG level is shown below: Change in weight Change in TG level This graph shows clearly the nature of the patients. Their weights and the change in the TG level are shown. It can be seen from the graphs that majority of the patients being to the class of 2.1 - 3.0. this means that maximum number of patients have lost 2.1 - 3 kgs in the eight weeks and the change in the TG level for maximum number of patients is between 11 - 55 mg/ dl. The line graph that shows the changes of weight and TG level are shown below: The purpose of the line graph is to show the changes in the weight loss and TG level comparatively. The change in weight is does not show a wide range and hence, when taken in a scale of 100 shows almost a straight line, but the TG level changes to a wider range and hence, the graph shows sharp differences. Also the pie chart of the continuous data is presented below: Change in weight Change in TG level The pie chart shows that maximum number of patients are between the class of 2.1 - 3 kgs weight loss. And the maximum number of patients have change in TG level of 11 - 55 mg/dl. From the data given, we have constructed three types of graphs. The various types of graphs show the same point as mentioned above, but these graphs help in understanding the pattern of the data given which is very crucial for identifying the relationship between these two variables. To answer the question, whether there is any relationship between the change in weight and change in TG level, correlation analysis has to be carried out. To carry out the correlation analysis, we have to develop a scatter diagram for the discreet data on change in weight and change in TG level and straight line to fit maximum number of data is drawn as follows: The line that fits the best shows that there is a linear relationship between the two variables. This means that when there is a decrease in weight, there is also a decrease in TG level. But for the data table, using a calculator, we can know that the change in weight and change in TG level are not proportionate. Hence, it can be recorded that when there is a decrease in weight, there is a decrease in TG level also, though not proportionate. It is quiet possible to predict the changes in TG level when there is a change in weight using the regression analysis. The term regression, is a process of predicting one variable from another known variable(1). In regression analysis, we develop a estimating equation, which is a mathematical formula that relates the known variable to the unknown variable. The estimating equation is, Y = a + bX, where, Y = dependent variable that is estimated a = Y intercept b = slope of the line X = independent variable From the table, we have to find out the mean values and then estimate a and b values. s.no Change in weight9(X) Change in TG level(Y) XY X2 1 -1.5 -349 523.5 2.25 2 0 7 0 0 3 0.4 17 6.8 0.16 4 1.2 8 9.6 1.44 5 1.5 -37 -55.5 2.25 6 1.6 -41 -65.6 2.56 7 1.6 -6 -9.6 2.56 8 1.6 59 94.4 2.56 9 1.8 55 99 3.24 10 2.3 56 128.8 5.29 11 2.4 27 64.8 5.76 12 2.4 -67 -160.8 5.76 13 2.5 51 127.5 6.25 14 2.6 57 148.2 6.76 15 2.6 1 2.6 6.76 16 2.7 -61 -164.7 7.29 17 2.8 74 207.2 7.84 18 2.8 -39 -109.2 7.84 19 3.2 32 102.4 10.24 20 3.6 69 248.4 12.96 21 3.7 -70 -259 13.69 22 4.1 0 0 16.81 23 5 18 90 25 24 5.2 30 156 27.04 25 5.8 68 394.4 33.64 26 5.9 4 23.6 34.81 27 6.2 15 93 38.44 28 7.1 -50 -355 50.41 29 7.2 80 576 51.84 30 7.4 58 429.2 54.76 31 7.8 169 1318.2 60.84 32 8 0 0 64 33 8.2 79 647.8 67.24 34 8.4 41 344.4 70.56 35 9.6 43 412.8 92.16 X = 137.7 Y = 491.33 XY= 5069.2 X2= 801.01 Here, X = mean value of weight loss = X/ n = 137. 7/ 35 = 3.9342 Y = mean value of change in TG level = Y/ n = 491.33/ 35 = 14.038 b = X Y - n X Y / X2 - n X2 = [5069.2 - (35x3.9342x14.038)] / [801.01 - (35x3.93422) = 12.0966 a = Y - b X = 14.038 - (12.0966 x 3.9342) = - 33.5537 By substituting the values of a and b in the following equation, we can predict the change in TG level for any given change in weight, Y = a + bX To predict the change in triglyceride level for a patient who loses 5 kg over an eight week period, we substitute 5 in the place of X. Y = - 33.5537 + (12.0966 x 5) = 26.9295 To predict the change in triglyceride level for a patient who loses 10 kg in weight, we have to substitute the value of X as 10 in the estimating equation as follows: Y = a + bX = - 33.5537 + (12.0966 x 10) = 87.4130 In the above used formula, b is the slope of the straight line. Hence, if we draw a straight line which has the slope of 12.0966, then it is quiet sensible to use a straight line for predicting the change in TG level. The marker points in black represent the prediction of change in TG level for change in weight by 10 kgs. SUMMARY OF RESULTS The results obtained from various statistical techniques are listed below: S.No Analysis Ungrouped Grouped Weight loss Change in TG level Weight loss Change in TG level 1. Mean 3.93 11.37 3.9 11.14 2. Median 2.8 18 2.988 19.8 3. Mode 2.4 0 2.76 22 4. Decrease in TG level when the weight lost is 5 kgs 26.925 5. Decrease in TG level when weight is decreased by 10 kgs 87.4130 From the various analysis it is clear that change in patient weight and change in TG level have a linear relationship. When there is a decrease in weight level, there will be a drop in the TG level also. But the change of these two variables in not proportionate. Correlation and regression analysis can be used to predict the changes in TG levels, when there is a change in the patient weight. Hence, it can be concluded that, when a patient wants to control his TG level, he should first control his body weight though exercises, proper food and drug treatment. REFERENCES 1. Levin, R. I (1978) Statistics for management, New Jersey, Prentice Hall 2. Moroney, M.J (2003) Facts from figures, Middlesex, Penguin books 3. Dixon, W and Massey, F (1969) Introduction to statistical analysis, New York, McGraw Hill 4. Hoel, P (1971) Introduction to mathematical statistics, New York, John Wiley & Sons Read More
Cite this document
  • APA
  • MLA
  • CHICAGO
(“Mathematics A: Statistics Coursework Assignment Research Paper”, n.d.)
Mathematics A: Statistics Coursework Assignment Research Paper. Retrieved from https://studentshare.org/science/1525462-mathematics-a-statistics-coursework-assignment
(Mathematics A: Statistics Coursework Assignment Research Paper)
Mathematics A: Statistics Coursework Assignment Research Paper. https://studentshare.org/science/1525462-mathematics-a-statistics-coursework-assignment.
“Mathematics A: Statistics Coursework Assignment Research Paper”, n.d. https://studentshare.org/science/1525462-mathematics-a-statistics-coursework-assignment.
  • Cited: 0 times

CHECK THESE SAMPLES OF Statistics Coursework

The Return of Stock

c) The rate of return of stock is approximately normally distributed as evident from the histogram.... The median as evident from the box plot calculations is 0.... 38306.... There are three lower outliers and 1 upper outlier in the data as seen in the box plot graph. ... hellip; ... ) This test can be used to detect tax evasions as the Bedford's law of distribution of the first digits of numbers in tax returns is NOT uniform....
3 Pages (750 words) Essay

Coursebook Content Writing

For your all coursework needs --XXX--- would be your right choice.... Thus you can easily depend on us for you any of your assignment coursework, essay or dissertation.... At this stage Students have take other general subjects like AQA biology coursework, A2 biology coursework, AS biology coursework and GCSE biology coursework....
169 Pages (42250 words) Essay

Data Descriptive Statistics and Visualization

This report “Data Descriptive statistics and Visualization” examines the life expectancy at birth in the OECD countries to see if there exists a difference in the life expectancy at birth between males and females.... It will also examine whether there is an effect of economic indicators....
9 Pages (2250 words) Assignment

Motility Assay for Control Organism

For the group Motility assay: After incubation for 24h at 37oC the mean value is 2.... 3, for the group Motility assay: After incubation for 48h at 37oC the mean value is 3.... 4 and for the group Motility assay for control organism, the mean value is 3.... 0.... The group Motility assay:… ter incubation for 48h at 37oC has the highest mean value with 3....
3 Pages (750 words) Coursework

Genetics and Phenotype of a Novel Mouse Mutant

The report should focus on the clear description, rationale and presentation of the analysis of the data.... This is not an essay (!... but it is useful to… The discussions should be short, but clearly define the major conclusions, which can be drawn from the data – or not. ... ... o not simply present the calculations, but explain the rationale of using a statistical method and It should state the result, its significance and any other conclusion(s), which may be relevant....
10 Pages (2500 words) Essay

Individual Market Return

The study wishes to determine if there is significant relationship in the time series regression CAPM.... The study will run a time series regression on each of the selected companies.... hellip; In this study these variables will be explored and the correlation between the dependent variable, and the independent variables. ...
4 Pages (1000 words) Coursework

CAPM Analysis, Is CAPM Use the Best

We collected weekly data from three sample periods.... That is, from January to December of: 2006 - 2008, 2009 - 2011 and 2012 – 2014.... Our… From the table results, we rejected Ho for 5 companies (AAL, CCH, EVR, RRS and VED company) since t-statistic was greater than the critical value....
5 Pages (1250 words) Coursework

Content Writing of Coursework

The author states that tackling mathematical and statistical problems need not be a pain anymore with the Math coursework.... Along with English coursework, media coursework and others aimed at GCSE; this coursework is an important part of the GCSE exam… Company name speaks of a variety of elements that will help the sociology coursework in terms of professional education perform in the social sphere.... The coursework has been fashioned such that it acts as a base upon which a student can follow his or her individual interests through our related courses....
49 Pages (12250 words) Assignment
sponsored ads
We use cookies to create the best experience for you. Keep on browsing if you are OK with that, or find out how to manage cookies.
Contact Us