StudentShare
Contact Us
Sign In / Sign Up for FREE
Search
Go to advanced search...
Free

In Psychology and Behaviour - Assignment Example

Cite this document
Summary
This assignment "Assignment in Psychology and Behaviour" analysis the people's behavioural observation for a short period of 13 days, represents some graphs and answers important questions about psychology. Observation of aggressive behaviour may include hurting self or another…
Download full paper File format: .doc, available for editing
GRAB THE BEST PAPER98.8% of users find it useful
Assignment in Psychology and Behaviour
Read Text Preview

Extract of sample "In Psychology and Behaviour"

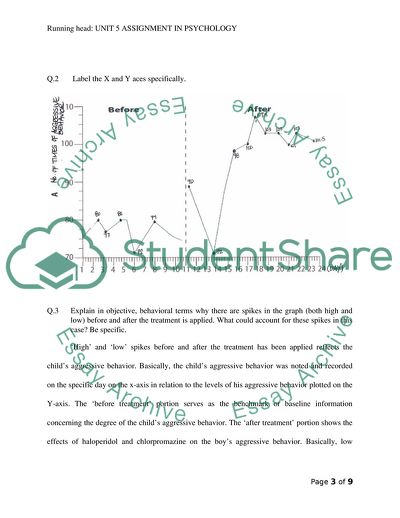
Unit 5 Assignment in Psychology Total Number of Words 250 Graph A Q What behavior are you observing? that the behavior you select should be specific, observable, and measureable. The purpose of multiple baseline design is to measure the subject’s behavior without treatment and at the time the subject receives the treatment. As a non-concurrent multiple baseline design, the first graph is a single case which aims to evaluate and observe the effects of pharmacotherapy such as the use of haloperidol and chlorpromazine as a treatment for 8-year old autistic boy who shows aggressive behavior disorder in class (Sturmey). Using applied behavior analysis or behavioral observation for a short period of 13 days, the effects of haloperidol and chlorpromazine as treatment for 8-year old autistic boy who shows aggressive behavior disorder in class was plotted on the first graph. Observation of aggressive behavior may include hurting self or another person either verbally, physically or emotionally. Basically, aggressive behavior is measured based on the number of times or incidence the boy has shown aggressive behavior within and outside the vicinity of the classroom environment. For example, was the boy seen or reported hurting one of his classmates during class and/or outside the school hours? Q.2 Label the X and Y aces specifically. Q.3 Explain in objective, behavioral terms why there are spikes in the graph (both high and low) before and after the treatment is applied. What could account for these spikes in this case? Be specific. ‘High’ and ‘low’ spikes before and after the treatment has been applied reflects the child’s aggressive behavior. Basically, the child’s aggressive behavior was noted and recorded on the specific day on the x-axis in relation to the levels of his aggressive behavior plotted on the Y-axis. The ‘before treatment’ portion serves as the benchmark or baseline information concerning the degree of the child’s aggressive behavior. The ‘after treatment’ portion shows the effects of haloperidol and chlorpromazine on the boy’s aggressive behavior. Basically, low spikes mean lesser degree of aggressive behavior whereas high spikes mean severe aggressive behavior. Q.4 The graphed “after” data is a saw tooth pattern. Does this mean that the treatment being applied is ineffective? Why or why not? Would you expect to see a smooth, straight line as opposed to the saw tooth pattern? Why or why not? Saw tooth pattern in a multiple baseline design does not always mean that the treatment has been effective or ineffective. First of all, one has to consider the uniqueness of each case. Specifically the case presented in this paper is about aggressive behavior in autistic child. Therefore, high spikes in the “after treatment” data mean that the treatment has been ineffective. The case is totally different if the case being observed is an adult man with history of smoking who is receiving smoking cessation treatment. If the variable used in the multiple baseline design is all about the number of cigarette sticks the adult man smokes each day, then the low spikes in the multiple baseline design strongly suggest that the treatment used in smoking cessation is effective (Dallery, Cassidy and Raiff). Personally, I do not expect to see a moth, straight line as opposed to the saw tooth pattern. As a neuroleptic medication, the use of haloperidol and chlorpromazine as a treatment for 8-year old autistic boy who shows aggressive behavior disorder does not always show the same effects on each subject (Sturmey). In line with this, Sturmey mentioned that the use of haloperidol and chlorpromazine could either increase, decrease, or has no significant effect on the child’s aggression. Q.5 In this case, would you want to see the “after” half of the grid elevated? In other words, is it a good thing to have the behavior graphed at higher levels after treatment than at baseline? Why or why not? Explain your answer. In this hypothetical situation, variable include the number of times or incidence the boy has shown aggressive behavior within and outside the vicinity of the classroom environment. Therefore, I do not want to see the “after” half of the grid to be elevated. As compared to the baseline, it is better to have the behavior graphed at lower levels after treatment. As mentioned earlier, the variable used in this particular non-concurrent multiple baseline design is being represented by the number of times or incidence the boy has shown aggressive behavior within and outside the vicinity of the classroom environment. Therefore, an elevated graph in the “after” half of the grid means that the pharmacotherapy used in this case is not effective at all. Q.6 Explain why it is unlikely that the Y axis represents a percentage. It is unlikely for the Y axis to be represented by a percentage because the baseline information is not fixed. For this reason, there is no appropriate level for us to measure the percentage. Graph B Q.1 What behavior are you observing? Note that the behavior you select should be specific, observable, and measureable. Case B will purposely observe the learning abilities of a 16 year-old boy who is attending 6th grade in a normal school. Aside from signs of dyslexia, the young boy also has relatively low grades as compared to his classmates. For this reason, his teacher decided to put in a special class together with other students who are experiencing difficulties in learning. Intervention for children with dyslexia include the use of special teaching techniques, the need to modify the classroom environment, and the proper use of technology. During the treatment process, variables that will focus on the scores the young boy receives in class (i.e. 80%, 90%, etc.). Q.2 Label the X and Y aces specifically. Q.3 Explain in objective, behavioral terms why there are spikes in the graph (both high and low) before and after the treatment is applied. What could account for these spikes in this case? Be specific. Before attending special class, the young boy with learning disability like dyslexia received a test score of 20% on day 1, 40% on day 2, or even 5% on day 4. Basically, the high or upward trend spikes in the graph show that there is improvement in the boy’s academic performance. On the other hand, low or downward trend in the graphs strongly suggest that the child’s academic performance is getting worst. Q.4 The graphed “after” data is a saw tooth pattern. Does this mean that the treatment being applied is ineffective? Why or why not? Would you expect to see a smooth, straight line as opposed to the saw tooth pattern? Why or why not? The presence of a saw tooth pattern in the “after” data does not necessarily mean that the treatment or intervention method used to correct the learning disability of the child is in effective. So long as the trend is going upward, the child’s learning or academic performance can be seen as progressing. Considering the case of a child with learning disabilities, I do not expect to see a smooth straight line because nobody, not even children with normal learning abilities, can get 100% perfect score in one or all subjects in each semester. Q.5 In this case, would you want to see the “after” half of the grid elevated? In other words, is it a good thing to have the behavior graphed at higher levels after treatment than at baseline? Why or why not? Explain your answer. Absolutely, yes. I would like to see the “after” half of the grid elevated because it represents further improvement in the young boy’s academic performance. In fact, the only way to see whether or not the treatment or intervention process given to the child is effective or not is to take note as to whether or not the plotted marks on the “after” half of the graph is much higher as compared to the plotted marks on the baseline portion (before) of the graph. In other words, assuming that the plotted marks on the “after” half portion of the graph is much lower than the plotted marks on the “before” half portion of the graph means that the combined use of special teaching techniques, the need to modify the classroom environment, and the proper use of technology were not effective in terms of treating the child’s dyslexia. Q.6 There are some missing data from the baseline trials. What could account for this? Does the missing data significantly affect the interpretation of the “before” behavior? Should the researcher throw out all of the recorded data and start over because there was a period of time where data was not recorded? Applicable to the hypothetical situation provided in case B, the missing data on the baseline trials could mean that the students did not have any class on the 11th and 12th day of school. It could also mean that the teacher did not provide any form of examination on day 11 and 12. Basically, the missing data on the baseline trials will not literally affect the interpretation of the academic performance of the child before he was transferred to a special class. Considering the fact that the missing data on the baseline trials does not have any impact on the measurement of the child’s academic performance could mean that it is pointless for the researcher to not throw away the existing record. In fact, there are so many possibilities as to why there can be a missing data on the graph. Instead of throwing out the record, the researcher should spend some time knowing the real reasons as to why there were some missing data on the graph. By writing down the reasons behind the missing data, people who will read the graph can have better understanding about the entire case scenario. References Dallery, J., Cassidy, R. N., & Raiff, B. R. (2013). Single-Case Experimental Designs to Evaluate Novel Technology-Based Health Interventions. Journal of Medical Internet Research, 15(2): e22. Sturmey, P. (n.d.). Chapter 4 - Treatment interventions for people with aggressive behaviour and intellectual disability. Retrieved September 29, 2014, from http://www.slam.nhs.uk/media/199428/treatment_for_aggression.pdf Read More
Cite this document
  • APA
  • MLA
  • CHICAGO
(Assignment in Psychology and Behaviour Example | Topics and Well Written Essays - 1750 words, n.d.)
Assignment in Psychology and Behaviour Example | Topics and Well Written Essays - 1750 words. https://studentshare.org/psychology/1840405-unit-5-assignment
(Assignment in Psychology and Behaviour Example | Topics and Well Written Essays - 1750 Words)
Assignment in Psychology and Behaviour Example | Topics and Well Written Essays - 1750 Words. https://studentshare.org/psychology/1840405-unit-5-assignment.
“Assignment in Psychology and Behaviour Example | Topics and Well Written Essays - 1750 Words”. https://studentshare.org/psychology/1840405-unit-5-assignment.
  • Cited: 0 times

CHECK THESE SAMPLES OF Assignment in Psychology and Behaviour

Freud's Psychology

He is considered as one of the most influential and controversial people who played a significant role in developing various psychology theories.... He is considered as one of the most influential and controversial people who played a significant role in developing various psychology theories.... Through his theories, Freud's work in considered of significant importance especially in the psychology related areas....
7 Pages (1750 words) Assignment

Intellectually stimulating events

This then describes what psychology needs to deal with, and in essence explore the out of sight meaning that life hides from our daily thinking and imaginations.... An Introduction to social psychology.... Name: Class Name: Date Assignment is due: Intellectually stimulating events The activity predisposed to instigate in me a different view towards humanity....
3 Pages (750 words) Assignment

Scientific Study of Human Behavior

psychology is the scientific study of human behavior and mental functions.... Modern psychology began taking shape in the in the beginning of the 20th century.... Sigmund Freud made significant contributions to modern psychology by studying human behavior through the unconscious mind....
4 Pages (1000 words) Assignment

The Explanations on Human Behavior

here are five different basic research methods in psychology that are used to identify different behaviors and understand them better: case studies, naturalistic observation, correlational research, survey research, and experimental methods.... The paper highlights that  Social loafers will generally be capable when left on their own, and it is only when placed within a group for the purpose of achieving some goal that they shrink back from responsibility and cease to contribute any thoughts or ideas on the subjects at hand....
5 Pages (1250 words) Assignment

Mimicry or alcohol

Journal of Experimental Social psychology, 48(1), 361-365.... The authors wanted to study whether human beings with all their empathy could mimic the actions and behavior of people in the out group as well as they would those in the in group.... They further wanted to determine whether the mimicry behavior was a culturally learnt aspect and… The research question posed is whether mimicry will help to better or worsen the perception of the people in the out groups?...
2 Pages (500 words) Assignment

Global Human Resource Management of Royal Dutch Shell

The paper “Global Human Resource Management of Royal Dutch Shell” aims to concentrate on the recommendation of understanding the cultural context in which Royal Dutch Shell operates.... Royal Dutch Shell must have an appreciation of the dimensions of the national cultures.... hellip; The author states that some cultures are characterized by a strong slant towards collectivism and both societal and organizational levels....
10 Pages (2500 words) Assignment

Introduction to Psychology

The problem of anthropomorphism in psychology is that a rat that is confined to a cage is unable to definitely display emotions and characteristics that are more common with humans.... nbsp;… Shaping is a form of reinforcement, which involves changing the behaviour of the subject; in this case, shaping pigeons to peck at a screen in a certain spot.... Chaining is when the subject is taught something outside of their normal behaviour.... This paper "Introduction to psychology" focuses on the fact that in regards to the Pigeons in a Pelican study, the reinforcement would be what would take place if the pigeons were to stop pecking at the screens....
7 Pages (1750 words) Assignment

Health Behavioural Change

In his book 'The psychology of interpersonal relations', psychologist Heider Fritz (1896-1988) for the first time developed attribution theory in the year 1958.... The paper "Health Behavioural Change" discusses that the locus of control scale is used to assess health education program success....
9 Pages (2250 words) Assignment
sponsored ads
We use cookies to create the best experience for you. Keep on browsing if you are OK with that, or find out how to manage cookies.
Contact Us