StudentShare
Contact Us
Sign In / Sign Up for FREE
Search
Go to advanced search...
Free

Relationship between the Two Variables - Assignment Example

Cite this document
Summary
This assignment "Relationship between the Two Variables" discusses the relationship between the overall quality as an instructor and the overall course quality. P-value=0.000<0.01. We reject the null hypothesis and conclude that there exists a relationship between the two variables…
Download full paper File format: .doc, available for editing
GRAB THE BEST PAPER95.4% of users find it useful
Relationship between the Two Variables
Read Text Preview

Extract of sample "Relationship between the Two Variables"

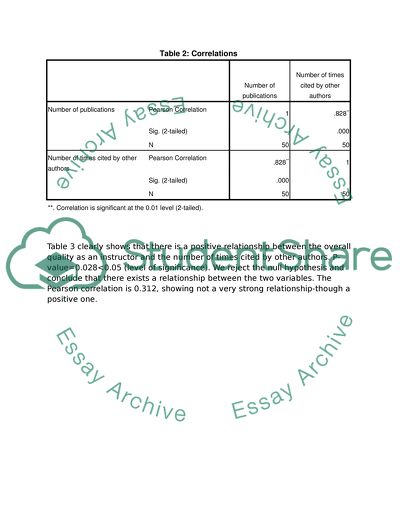
Table 3: Correlations


Number of times cited by other authors

Overall quality as an instructor

Number of times cited by other authors

Pearson Correlation

1

.312*

Sig. (2-tailed)


.028

N

50

50

Overall quality as an instructor

Pearson Correlation

.312*

1

Sig. (2-tailed)

.028


N

50

50

*. Correlation is significant at the 0.05 level (2-tailed).


PART TWO (2)

Table 4 clearly shows that there is a positive relationship between the anxious behavior rating and the interview. P-value=0.000<0.01 (level of significance).  We reject the null hypothesis and conclude that there exists a relationship between the two variables. The Pearson correlation is 0.881 which implies a strong relationship.

Table 4: Correlations


Anxious Behavior Rating (Range 0 to 25)

Interview (Range 0 to 9)

Anxious Behavior Rating (Range 0 to 25)

Pearson Correlation

1

.881**

Sig. (2-tailed)


.000

N

28

28

Interview (Range 0 to 9)

Pearson Correlation

.881**

1

Sig. (2-tailed)

.000


N

28

28

**. Correlation is significant at the 0.01 level (2-tailed).


Table 5 clearly shows that there is a negative relationship between the number of mistakes on maze tasks and the dysfunction core. For instance, as the number of mistakes on maze task increases the dysfunction score decreases. This can be explained by the p-value, from table 5, the p-value=0.000<0.01 (level of significance). We reject the null hypothesis and conclude that there exists a relationship between the two variables. At the same time, the Pearson correlation is -0.944 implying a strong negative relation.

Table 5: Correlations


Number of Mistakes on Maze Task

Dysfunction Score

Number of Mistakes on Maze Task

Pearson Correlation

1

-.944**

Sig. (2-tailed)


.000

N

14

14

Dysfunction Score

Pearson Correlation

-.944**

1

Sig. (2-tailed)

.000


N

14

14

**. Correlation is significant at the 0.01 level (2-tailed).


Read More
Cite this document
  • APA
  • MLA
  • CHICAGO
(“SPSS assignment Example | Topics and Well Written Essays - 250 words - 5”, n.d.)
SPSS assignment Example | Topics and Well Written Essays - 250 words - 5. Retrieved from https://studentshare.org/psychology/1616620-spss-assignment
(SPSS Assignment Example | Topics and Well Written Essays - 250 Words - 5)
SPSS Assignment Example | Topics and Well Written Essays - 250 Words - 5. https://studentshare.org/psychology/1616620-spss-assignment.
“SPSS Assignment Example | Topics and Well Written Essays - 250 Words - 5”, n.d. https://studentshare.org/psychology/1616620-spss-assignment.
  • Cited: 0 times

CHECK THESE SAMPLES OF Relationship between the Two Variables

Scatterplot for Credit Balance and Size

SIZE The Relationship between the Two Variables, Credit Balance and the Size, is illustrated in the scatter plot below.... As can be seen from the above scatter plot there exists a Relationship between the Two Variables as with increase in the size of number of people living in a house, the credit balance also increases and vice versa.... From the graph, it there seems a linear Relationship between the Two Variables as shown below.... The result revealed that the Relationship between the Two Variables is best determined by linear relationship using following equation: Regression Analysis: Credit Balance($) versus Size The regression equation is Credit Balance($) = 2591 + 403 Size Predictor Coef SE Coef T P Constant 2591....
10 Pages (2500 words) Assignment

Democracy Book Report

The research paper seeks to establish the causal Relationship between the Two Variables but uses the "dynamic panel generalized method of moment (GMM)".... The research paper aims to examine the strength of the Relationship between the Two Variables and determine whether a democratic form of government is more likely to cause a higher variation in growth in the country.... The paper gives detailed information about paper which is titled "Does democracy lower growth volatility A Dynamic panel analysis" published in the Journal of Macroeconomics in 2008 deals with the exploration of the relationship between democracy and the volatility of growth....
1 Pages (250 words) Literature review

Power of Hindon Designs Plc

The author states that there is no significant relationship between the independent variables represented by Factors 1 to 7 (product effectiveness, design, reliability, price competitiveness, delivery, service, and website) and the dependent variable represented by Factor 8 (individual purchasing share).... The complete workings with 26 figures and two tables are shown in Appendix 1.... The combined scatterplots for Factors 8 and Factors 1 to 7, showed that: (1) Factor 8 has a very strong relationship with Factor 5 and overall satisfaction; (2) Factor 8 has a substantial to very strong association with Factors 1 and 2; and (3) Factor 8 has a low to moderate relationship with Factors 3, 6 and 7, although 7 tends to be negatively correlated with Factor 8....
16 Pages (4000 words) Assignment

Correlation between Annual Income and Amount Spent on Car

9 which indicates a strong Relationship between the Two Variables.... he Correlation coefficient is positive confirming the positive association between the two variables.... The paper "Correlation between Annual Income and Amount Spent on Car" highlights that the two variables, annual income and amount spent on the car are expected to have a positive correlation.... n order to identify the direction of causality, the two variables are analyzed objectively....
4 Pages (1000 words) Essay

Correlation and Regression

On graph, an inverse and linear line can be drawn for predicting this Relationship between the Two Variables.... Since the relationship is formulated in such a manner that if patients taking longer time drug X, their tumor is found to be smaller in size which denotes the inverse or negative Relationship between the Two Variables.... Thus, the strength of Relationship between the Two Variables is found to be very low as both the coefficient of correlation and coefficient of determination for both of these variables are too small to show any strong association between the two variables ...
2 Pages (500 words) Essay

Analysts dispersion forecast

Having examined the historical data, we will then identify the importance of the Relationship between the Two Variables so as to drive an appropriate trading strategy.... Based on our analysis, there is sufficient empirical evidence confirming our hypothesis that there is a significant negative Relationship between the Two Variables for the hedged portfolios and the Fama-MacBeth analysis for the smaller cap firms.... At the beginning, this report examines the historical data for security returns and the Analyst Forecast Dispersion between the period 1983- 2005....
2 Pages (500 words) Essay

Relationship between Teenagers Usage of the Internet and Amount of Sleep

CorrelationIn order to test for a significant Relationship between the Two Variables, we conducted a correlation test.... The paper "Relationship between Teenagers Usage of the Internet and Amount of Sleep" discusses that it is evident that there exists a strong relationship between the number of hours spent by teenage students in using the internet and the number of hours they spend asleep.... two variables were used to test for the quantitative impact of the study....
6 Pages (1500 words) Assignment

Concentration-Effect Curves for Histamine-Induced Effect of Guinea-Pig Ileum

The graph slopes from the upper left of the scatter plot to the lower right suggesting a negative Relationship between the Two Variables.... This paper 'Concentration-Effect Curves for Histamine-Induced Effect of Guinea-Pig Ileum ' investigates сoncentration-effect curves for the histamine-induced effect of guinea-pig ileum in the presence and absence of the concentrations of mepyramine....
5 Pages (1250 words) Lab Report
sponsored ads
We use cookies to create the best experience for you. Keep on browsing if you are OK with that, or find out how to manage cookies.
Contact Us