StudentShare
Contact Us
Sign In / Sign Up for FREE
Search
Go to advanced search...
Free

Statistical Evaluation of Information - Essay Example

Cite this document
Summary
The essay "Statistical Evaluation of Information" focuses on the critical analysis of the major issues in the statistical evaluation of information. A nominal scale is the assignment of numbers or symbols to designate a sub-class that represents unique characteristics…
Download full paper File format: .doc, available for editing
GRAB THE BEST PAPER92.8% of users find it useful
Statistical Evaluation of Information
Read Text Preview

Extract of sample "Statistical Evaluation of Information"

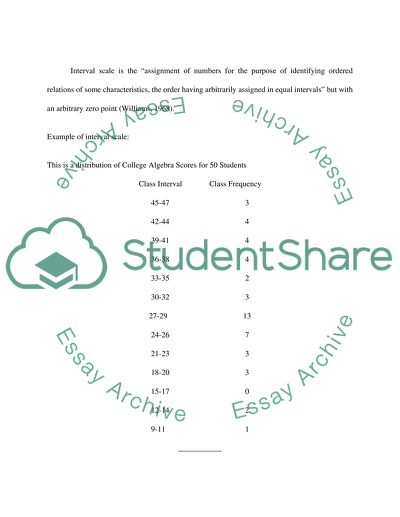
For question Nominal scale is defined as the "assignment of numbers or symbols for the purpose of designating sub which represents unique characteristics" (Williams, 1968). It is used to identify classes. Example of nominal data: Day No. Sunday 1 Monday 2 Tuesday 3 Wednesday 4 Thursday 5 Friday 6 Saturday 7 Ordinal scale is a measurement scale that assigns values to objects based on their ranking with respect to one another. This scale is more sophisticated compared to the nominal scale. Here, larger scores reflect more of the quantity or quality, but units along the scale are unequal in sizes (Williams, 1968). Example of nominal data: For a questionnaire that needs to derive accurate response from the respondents, the following measures can be used: Rank Measure 1 Strongly agree 2 Agree 3 Undecided 4 Disagree 5 Strongly disagree Interval scale is the "assignment of numbers for the purpose of identifying ordered relations of some characteristics, the order having arbitrarily assigned in equal intervals" but with an arbitrary zero point (Williams, 1968). Example of interval scale: This is a distribution of College Algebra Scores for 50 Students Class Interval Class Frequency 45-47 3 42-44 4 39-41 4 36-38 4 33-35 2 30-32 3 27-29 13 24-26 7 21-23 3 18-20 3 15-17 0 12-14 2 9-11 1 ___________ N=50 Ratio data is the "assignment of numbers for the purpose of identifying ordered relations of some characteristics, the order having arbitrarily assigned in equal intervals but with an absolute zero point (Williams, 1968). For question #2 Pre testing- this is done to determine the response or knowledge and awareness of the respondents without the aid or intervention of media or materials regarding that certain topic. Post-testing is done after the respondents have been affected or influenced by the method or material that may change their response or knowledge about the topic. Note that the question on this matter but the results will differ because something has affected the respondents' knowledge and awareness. There might be some possible changes on the answer of the respondents but there are cases that their perceptions are not affected at all. For a case study on child's rights, a survey can be done on the spot with the kids. This serves as the pre-test. Later on, after letting them watch a video clipping about child's rights, a post-test survey can be done to determine if their awareness has been changed. Time series data are measurements of a variable taken at regular intervals over time. Time series are represented as sequences of values like x(1), x(2), ... . The time line of invention and innovation for modern transport may be as follows: Stage coach Train Car Plane Rocket Space ship ____________________________________________________ 1800 1900 2000 Non- equivalent comparison this simply refers to the data obtained from different period or time interval without the specific limits or lapses. The data can be obtained whether in a three-year, four- year or five- year intervals instead of taking it in a specific 100-year interval. Time series analysis is the comparison of data represented in a time series. It includes almost all classes of statistical approaches and problems: data description, hypothesis testing , parameter estimation , regression , etc. The practical importance of time series analysis stems from the fact that time series data - economic, social, sport, physical, etc. - are quite common. Experimental is a kind of research design conducted to answer questions about causes and effects. The basic requirements are; a) random assignment, b) treatment and no-treatment groups, c) observations after the treatment. The following notations are used in describing the different experimental designs: X=stands for an experimental treatment, or an independent variable or a cause O=stands for observation, or a dependent variable, or an effect R=means that the respondents have been randomly assigned to the different treatment or non- treatment groups or conditions For question #3 If I am doing a study on the relationship of the scores obtained by the students on their college algebra subject versus the time they allotted daily in studying the subject, the following variables can be used or determined: Independent variable Dependent Variable Age Score Gender Class Standing/Performance Time Spent in Reviewing Favorite Subject Independent variable is the presumed cause while the dependent variable is the presumed effect. Meaning to say, the independent variable is not affected by any factors involved in the study while the dependent variable determines how the respondents are affected by the factors involved. For question #4 Simple random sampling is a technique of selecting n individuals out of N, such that everyone has equal chances of being selected. Sample individuals are selected at points entirely at random within population. This technique is suitable for homogenous populations. As long as an individual is a member of the population, he/she can be chosen as a sample since the process is in a random basis. Stratified or proportional random sampling is applicable when the population is not homogenous wherein the random sample may not be representative of the population. In this method, the population is divided into homogenous group called strata, then, the samples are drawn either by simple random sampling or stratified sampling from each formed strata. For precise results, the total number of the desired sample may be allocated equally among the strata. The technique prevents any chance concentration of sample units in one part of the field because they are well distributed. The strata for example is the different classification such as freshman, sophomore, junior, senior. Systematic random sampling is obtained by numbering all the individuals in the population consecutively. The first sample is selected through a simple random process, then, the succeeding samples are chosen at pre-established intervals. To determine the appropriate interval, divide N by the desired number of sample. For question #5 As defined in question #2, pre-testing is done to determine the response or knowledge and awareness of the respondents without the aid or intervention of media or materials regarding that certain topic. The purpose of pre-test is to determine if there is a difference between the results of a study if an intervention or aid of materials is to be applied. It is more useful in the KAP or the Knowledge, Attitude and Practices study where you can determine if allowing the respondents to watch or read something about the particular topic you are studying would affect the level of awareness, attitude and practices. The results of the pre-test and the post-test can be compared so that the change of difference can be obtained. The use of pre-test is actually independent on the group of the respondents but it is more on the desired results a study wants to obtain. On the other hand, the following sampling techniques may be helpful in the application of pre-testing. Judgment sampling whereby you select a representative sample according to your subjective system. Quota sampling which refers to the variation of judgment sampling which provides more explicit instructions on what to select and a definite quota must be filled in. Accidental sampling wherein everyone who happens to be present at the time the study was conducted became part of the sample regardless of his/her perception of the topic of the study. For question #5 Descriptive statistics includes the techniques which are concerned with summarizing and describing numerical data. This method can either be graphical or computational. It is used to present and analyze information in a convenient, usable and understandable form. Class Interval Midpoint Class Frequency Scores x f fx ______________________________________________________________ 45-47 46 3 138 42-44 43 4 172 39-41 40 4 160 36-38 37 4 148 33-35 34 2 68 30-32 31 3 93 27-29 28 13 364 24-26 25 8 200 21-23 22 3 66 18-20 19 3 57 15-17 16 0 0 12-14 13 2 26 9-11 10 1 10 __________________________ N=50 fx= 1502 Formula in finding the mean: Solution: M= fx N M= fx N Where: f= class frequency x = class midpoint = 1502 N = Sum of frequencies 50 = 30.04 The standard deviation is a measure of variability that is more convenient than percentile differences for further investigation and analysis of statistical data. The standard deviation of a set of measurements x1, x2, , xn, with the mean is defined as the square root of the mean of the squares of the deviations; it is usually designated by the Greek letter sigma (s). In symbols S = (x - x) 2 n Where: S = standard deviation (sometimes known as root mean square of a sample) x = observed value x = sample mean n = total number of observed value For the Ungrouped Data: S = (x - x) 2 n - 1 For a Given Population: = (x - u) 2 N Where: = standard deviation for the population The square, s2, of the standard deviation is called the variance. If the standard deviation is small, the measurements are tightly clustered around the mean; if it is large, they are widely scattered. 2-Tailed vs. 1-Tailed Tests: The purpose of a hypothesis test is to avoid being fooled by chance occurrences into thinking that the effect you are investigating (for example, a difference between treatment and control) is real. If you are investigating, say, the difference between an existing process and a (hopefully improved) new process, observed results that don't show an improvement would not interest you so you do not need to protect yourself against being fooled by "negative" effects, no matter how extreme. A 1-tailed test would be appropriate. If, on the other hand, you are interested in discerning a difference between samples A and B (regardless of which direction the direction goes), a 2-tailed test would be appropriate. . (www.google.com, January 26, 2006) Correlation Coefficient: The correlation coefficient indicates the degree of linear relationship between two variables. The correlation coefficient always lies between -1 and +1. -1 indicates perfect linear negative relationship between two variables, +1 indicates perfect positive linear relationship and 0 indicates lack of any linear relationship. (www.google.com, January 26, 2006) The square of a random variable having standard normal distribution is distributed as chi-square with 1 degree of freedom. The sum of squares of 'n' independently distributed standard normal variables has a Chi-Square distribution with 'n' degrees of freedom. The distribution is typically used to compare multiple-sample count data in contingency tables to expected values under a null hypothesis. (www.google.com, January 26, 2006) WORKS CITED: "How to Write a Thesis Proposal: Some Practical Guidelines". 3rd Ed. Librero, Felix. University of the Philippines, Los Banos, College of Agriculture, College Laguna, Philippines. 1996. "Statistical Terms and Glossary". www.google.com. January 26, 2006. Read More
Cite this document
  • APA
  • MLA
  • CHICAGO
(“Information for proposal Essay Example | Topics and Well Written Essays - 2250 words”, n.d.)
Retrieved from https://studentshare.org/miscellaneous/1521785-information-for-proposal
(Information for Proposal Essay Example | Topics and Well Written Essays - 2250 Words)
https://studentshare.org/miscellaneous/1521785-information-for-proposal.
“Information for Proposal Essay Example | Topics and Well Written Essays - 2250 Words”, n.d. https://studentshare.org/miscellaneous/1521785-information-for-proposal.
  • Cited: 0 times
sponsored ads
We use cookies to create the best experience for you. Keep on browsing if you are OK with that, or find out how to manage cookies.
Contact Us