StudentShare
Contact Us
Sign In / Sign Up for FREE
Search
Go to advanced search...
Free

Understanding of the Trends of Voting in the British Population - Statistics Project Example

Cite this document
Summary
From the paper "Understanding of the Trends of Voting in the British Population" it is clear that to better understand the voting preferences and attitudes of the British population, a questionnaire is designed to collect political views from a sample of college students…
Download full paper File format: .doc, available for editing
GRAB THE BEST PAPER96.9% of users find it useful
Understanding of the Trends of Voting in the British Population
Read Text Preview

Extract of sample "Understanding of the Trends of Voting in the British Population"

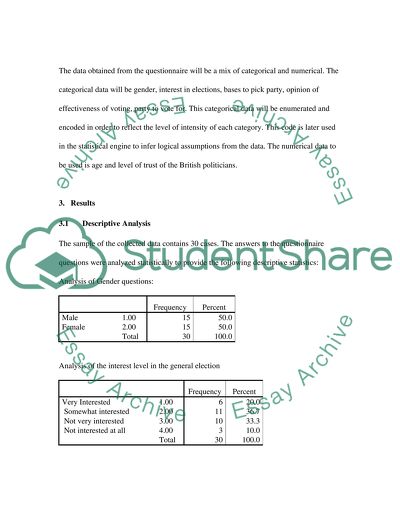
1. Introduction This survey attempts to measure the way in which people vote. It also measures the political attitudes of the voters and their opinion of different political issues. The objective of this survey is to increase our understanding of the trends of voting in the British population and predict the voting preference based on a number of dependent variables. 1.1 Method A questionnaire is designed to test the different determining factors in the voting process. The questionnaire was to be given face to face to a number of thirty students attending different years of college. The dependent variable was the vote the sample picked in their questionnaire. The independent variable is gender, age, level of interest in elections, bases to pick political party, level of trust in British politicians and opinion regarding effectiveness of voting. The questionnaire is to include all of the independent and dependent variables. The answers of the questionnaire are entered in the SPSS processor for statistical analysis. 2. Questionnaire Development The questionnaire is designed to collect the level of each of the independent variables mentioned in the previous section in addition to the intended vote which is the dependent variable. The data obtained from the questionnaire will be a mix of categorical and numerical. The categorical data will be gender, interest in elections, bases to pick party, opinion of effectiveness of voting, party to vote for. This categorical data will be enumerated and encoded in order to reflect the level of intensity of each category. This code is later used in the statistical engine to infer logical assumptions from the data. The numerical data to be used is age and level of trust of the British politicians. 3. Results 3.1 Descriptive Analysis The sample of the collected data contains 30 cases. The answers to the questionnaire questions were analyzed statistically to provide the following descriptive statistics: Analysis of Gender questions: Frequency Percent Male 1.00 15 50.0 Female 2.00 15 50.0 Total 30 100.0 Analysis of the interest level in the general election Frequency Percent Very Interested 1.00 6 20.0 Somewhat interested 2.00 11 36.7 Not very interested 3.00 10 33.3 Not interested at all 4.00 3 10.0 Total 30 100.0 Figure 1: Frequency distribution for the interest level in the general election Analysis of the bases you pick the party you vote for Frequency Percent Good Policies 1.00 7 23.3 Good Leader 2.00 10 33.3 Don't know 3.00 13 43.3 Total 30 100.0 Analysis of the level of trust in the British Politicians in general From the above table it is evident that the trust level for the British politicians is 4.3 on a scale from zero to ten. The standard deviation is 2.61 indicating that almost 75% of the sample trusts their politicians at a level from 1.7 to 6.9. The following figure demonstrates the distribution of the level of trust among sample tested. Figure 2: Frequency distribution of the level of trust among sample Analysis of the acceptance of the sentence that most of my family and friends think that voting is a waste of time: Frequency Percent Strongly agree Agree 0 2.00 0 9 0 30.0 Neither 3.00 2 6.7 Disagree 4.00 16 53.3 Strongly Disagree 5.00 3 10.0 Total 30 100.0 From the above table it is evident that most of the sample (53.3%) disagrees with the indicated statement and thus concluding that most of family thinks that voting is not a waste of time. Analysis of the party the sample voted for in the coming elections: Frequency Percent Labour 1.00 13 43.3 Conservatives 2.00 13 43.3 Liberal Democrats 3.00 4 13.3 Total 30 100.0 From the above table it is evident that the sample would vote equally to either Lobour or Conservatives parties. 3.2 Inferential Analysis An alpha value of .05 is chosen to accept or reject the null hypothesis. The hypothesis to be tested is the level of dependence of the variable vote on the independent variables gender, age, level of interest in elections, bases to pick political party, level of trust in British politicians and opinion regarding effectiveness of voting. The following null hypothesis is suggested: The Null Hypothesis (Ho): the vote concerning the chosen political party depends on the variables gender, age, level of interest in elections, bases to pick political party, level of trust in British politicians and opinion regarding effectiveness of voting. Alternative Hypothesis (Ha): the vote concerning the chosen political party does not depend on the mentioned independent variables. Regression analysis is conducted on the data provided where variable vote is the dependent variable and all remaining variables are independent variables. The following regression table is generated from SPSS. Model Unstandardized Coefficients Standardized Coefficients t Sig. B Std. Error Beta B Std. Error 1 (Constant) .606 .840 .721 .478 Gender .351 .366 .248 .959 .348 age -.010 .011 -.271 -.945 .355 interestelection .105 .188 .134 .556 .584 reasonvote .102 .200 .115 .513 .613 Trust -.001 .061 -.004 -.018 .986 wasteoftime .173 .168 .250 1.027 .315 The above table demonstrates that the significance level of the different independent variables in predicting the vote dependent variable is larger that the chosen alpha value of .05. Thus there is not enough data to reject the null hypothesis. The provided data is not enough to predict the vote deciding the chosen political party. 4. Conclusion To better understand the voting preferences and attitudes of the British population, a questionnaire is designed to collect political views from a sample of college students. The questionnaire included categorical and numerical data which is analyzed using the statistical engine SPSS 15. The descriptive analysis of the data demonstrated the low level of trust of the sample in British politicians but showed the belief of the effectiveness of the voting process. The voting preference of the sample indicated equal preference towards voting for the Labour and Conservatives party. Regression analysis is conducted on the vote variable to predict its outcome from the values of the other independent variables. Results of the analysis indicated not enough evidence to predict the vote depending on available data. It is recommended to include more samples and collect other political preferences in order to provide enough data to predict the vote of British population. References British General Election Studies (2007). Obtained on August 12, 2007 from www.data-archive.ac.uk Burgess, T. (2001). A general introduction to the design of questionnaires for survey research. University of Leeds. Smith, T. (1999). Reporting Questionnaire Data. TIMSS Technical Report. Appendix I : Questionnaire 1. What is your gender 01 Male 02 Female 2. What is your year of birth Enter specific age given by respondent. 3. How interested are you in the General Election 1 Very interested 2 Somewhat interested 3 Not very interested 4 Not at all interested 4. On what bases did you pick the party you might vote for 01 Good policies 02 Good Leader. 03 Don't know. 5. On a scale from 0 to 10, where 10 means great deal trust and 0 means no trust. How much do you trust British politicians generally 6. How far you agree or disagree with the following statements: Most of my family and friends think that voting is a waste of time. 01 Strongly agree 02 Agree 03 Neither 04 Disagree 05 Strongly disagree 7. Which party do you think you would vote for in the coming elections 01 Labour 02 Conservatives 03 Liberal Democrats 04 Other Appendix II: SPSS Output FREQUENCIES VARIABLES=Gender /ORDER= ANALYSIS . Frequencies [DataSet0] D:Documents and SettingsAdministratorDesktoppolsci surveydata.sav FREQUENCIES VARIABLES=age /ORDER= ANALYSIS . Frequencies [DataSet0] D:Documents and SettingsAdministratorDesktoppolsci surveydata.sav DESCRIPTIVES VARIABLES=interestelection /STATISTICS=MEAN STDDEV MIN MAX . Descriptives [DataSet0] D:Documents and SettingsAdministratorDesktoppolsci surveydata.sav DESCRIPTIVES VARIABLES=interestelection /STATISTICS=MEAN STDDEV MIN MAX . Descriptives [DataSet0] D:Documents and SettingsAdministratorDesktoppolsci surveydata.sav FREQUENCIES VARIABLES=interestelection /ORDER= ANALYSIS . Frequencies [DataSet0] D:Documents and SettingsAdministratorDesktoppolsci surveydata.sav FREQUENCIES VARIABLES=reasonvote /ORDER= ANALYSIS . Frequencies [DataSet0] D:Documents and SettingsAdministratorDesktoppolsci surveydata.sav FREQUENCIES VARIABLES=reasonvote /ORDER= ANALYSIS . Frequencies [DataSet0] D:Documents and SettingsAdministratorDesktoppolsci surveydata.sav DESCRIPTIVES VARIABLES=Trust /STATISTICS=MEAN STDDEV MIN MAX . Descriptives [DataSet0] D:Documents and SettingsAdministratorDesktoppolsci surveydata.sav FREQUENCIES VARIABLES=wasteoftime /ORDER= ANALYSIS . Frequencies [DataSet0] D:Documents and SettingsAdministratorDesktoppolsci surveydata.sav DESCRIPTIVES VARIABLES=party /STATISTICS=MEAN STDDEV MIN MAX . Descriptives [DataSet0] D:Documents and SettingsAdministratorDesktoppolsci surveydata.sav FREQUENCIES VARIABLES=party /ORDER= ANALYSIS . Frequencies [DataSet0] D:Documents and SettingsAdministratorDesktoppolsci surveydata.sav CORRELATIONS /VARIABLES=Gender age interestelection reasonvote Trust wasteoftime party /PRINT=TWOTAIL NOSIG /MISSING=PAIRWISE . GET FILE='E:0 research0 doneSPSS08 polsci surveydata.sav'. DATASET NAME DataSet1 WINDOW=FRONT. FREQUENCIES VARIABLES=party /HISTOGRAM NORMAL /ORDER= ANALYSIS . FREQUENCIES VARIABLES=party Gender age interestelection reasonvote Trust wasteoftime /BARCHART FREQ /ORDER= ANALYSIS . Frequencies [DataSet1] E:0 research0 doneSPSS08 polsci surveydata.sav Bar Chart Correlations [DataSet0] D:Documents and SettingsAdministratorDesktoppolsci surveydata.sav REGRESSION /MISSING LISTWISE /STATISTICS COEFF OUTS R ANOVA /CRITERIA=PIN(.05) POUT(.10) /NOORIGIN /DEPENDENT party /METHOD=ENTER Gender age interestelection reasonvote Trust wasteoftime . Regression [DataSet0] D:Documents and SettingsAdministratorDesktoppolsci surveydata.sav NEW FILE. DATASET NAME DataSet2 WINDOW=FRONT. REGRESSION /MISSING LISTWISE /STATISTICS COEFF OUTS R ANOVA /CRITERIA=PIN(.05) POUT(.10) /NOORIGIN /DEPENDENT vote /METHOD=ENTER votereason trust statement gender age . Read More
Cite this document
  • APA
  • MLA
  • CHICAGO
(Understanding of the Trends of Voting in the British Population Statistics Project, n.d.)
Understanding of the Trends of Voting in the British Population Statistics Project. Retrieved from https://studentshare.org/politics/1502967-politisc
(Understanding of the Trends of Voting in the British Population Statistics Project)
Understanding of the Trends of Voting in the British Population Statistics Project. https://studentshare.org/politics/1502967-politisc.
“Understanding of the Trends of Voting in the British Population Statistics Project”, n.d. https://studentshare.org/politics/1502967-politisc.
  • Cited: 0 times

CHECK THESE SAMPLES OF Understanding of the Trends of Voting in the British Population

The Sociological Perspective

Thus, globalization is one of the reasons underlying the wide ethnic variety of the british population.... Meanwhile, the image of strong Western power causes the population of less developed countries to immigrate to Britain.... Indeed, expensive furniture created from mahogany is highly valued in the USA, UK, and Europe, which causes the Brazilian population to inflict serious damage to the Amazonian rainforest exporting mahogany overseas....
11 Pages (2750 words) Essay

Population Trends in Larids

This dissertation reveals the breeding population of great black backed, lesser black backed and herring gulls at coastal sites, that was definitively surveyed three times during the 20th century, in Operation Seafarer.... By analysis of the differences in the numbers observed in these three surveys, it is possible to show variation in population trends.... When examining the herring gull by latitude one of the greatest differences noted is the drastic decrease of the population in the 56-58N latitude in particular....
45 Pages (11250 words) Dissertation

To Build A Strong Brand Within The Fashion Industry

The essay analyzes how to build a strong brand in the fashion industry.... Branding of a product performs an extremely significant role in the determination of the consumers' buying behaviours.... This is because those brands which are perceived as strong provide imperceptible values.... hellip; The essay discovers the fashion industry....
15 Pages (3750 words) Essay

Running a Restaurant and a Bar

nbsp; Secondary materials are also going to be used to find out the requirements needed for the establishment of the facility among these, the historical background on tourism and hospitality development in the region, prospects in the development of the small scale hotels and bars in the region as well as the consumption trends and potentials of the people intended to use the facility upon its inception.... An increasing trend has been purported in the United Kingdom over the last few years as a result of the rising trends in development and financial development in the region....
12 Pages (3000 words) Case Study

Development of Low-Fat Sugar-Free Products

The interest of the consumers to eat healthy foods is a passing craze among the majority of the population globally.... The assignment elaborates on market research and market trends following a detailed analysis of the secondary sources in relation to the recent trend of consumers in opting for low-fat products in the UK market segments.... Depending on the analysis of the UK market, figures and trends related to the subject topic are detailed on the basis of development of market and product mix....
6 Pages (1500 words) Assignment

A Major Health Problem in British Society and Improving Medical Service

After World War II, population growth within the british society was very limited.... The essay intends to identify the potential changes that could be made to British society today to ensure a healthier population in 2020.... The major focus is laid upon the healthcare measures towards addressing the issue of the growing number of dementia patients in british society.... In recent years significant concern has been laid upon the growing number of patients with dementia in british society....
8 Pages (2000 words) Essay

How Important is the UK Economy in Shaping British Society

Lord Kinnock made the predictions based on the economic assessment of Graddol (2007) who wrote for the british Council.... The paper " How Important is the UK Economy in Shaping british Society" states that economic sociology teaches us that economics affect culture, values, politics, and social organization and there is an economics-environment-economics nexus.... The sense of individual responsibility has declined in british society due to the growth of the role of the state....
10 Pages (2500 words) Literature review

The Elements of Continuity and Change in the Ways in Which Poverty Has Been Defined

In light of the prevailing trends of poverty on a global stage, developing countries have experienced intense poverty levels.... … The paper "The Elements of Continuity and Change in the Ways in Which Poverty Has Been Defined" is a brilliant example of a term paper on sociology....
18 Pages (4500 words) Term Paper
sponsored ads
We use cookies to create the best experience for you. Keep on browsing if you are OK with that, or find out how to manage cookies.
Contact Us