StudentShare
Contact Us
Sign In / Sign Up for FREE
Search
Go to advanced search...
Free

Food Preferences Analysis - Essay Example

Cite this document
Summary
"Food Preferences Analysis" is a wonderful example of a paper on social and family issues. The study involved 30 individuals, 15 male, and 15 female respondents. This sample population of 30 individuals as well the equal number chosen for both gender ensured the study was not biased towards any of the gender and that the results as representative of the population where the sample was derived…
Download full paper File format: .doc, available for editing
GRAB THE BEST PAPER92.5% of users find it useful
Food Preferences Analysis
Read Text Preview

Extract of sample "Food Preferences Analysis"

"Food Preferences Analysis" is a wonderful example of a paper on social and family issues. 

The study involved 30 individuals, 15 male, and 15 female respondents. This sample population of 30 individuals as well the equal number chosen for both gender ensured the study was not biased towards any of the gender and that the results as representative of the total population where the sample was derived.

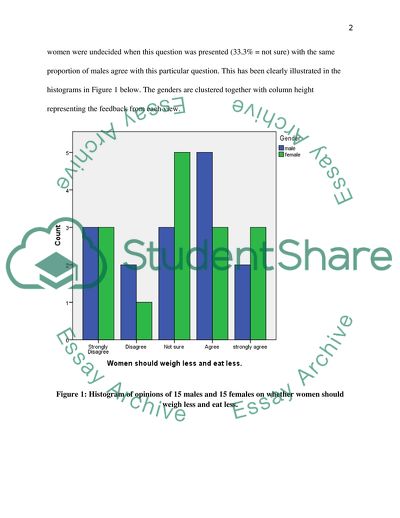
            In the section, where the questionnaire sought to know the view of the respondent towards whether women should weigh less and eat less, the entire group we interviewed gave feedback as illustrated in table 1 below

Table 1: Cross-tabulation; Women should weigh less and eat less.


Gender * Women should weigh less and eat less. Cross tabulation


Women should weigh less and eat less.

Total

Strongly Disagree

Disagree

Not sure

Agree

strongly agree

Gender

male

Count

3

2

3

5

2

15

% within Gender

20.0%

13.3%

20.0%

33.3%

13.3%

100.0%

female

Count

3

1

5

3

3

15

% within Gender

20.0%

6.7%

33.3%

20.0%

20.0%

100.0%

Total

Count

6

3

8

8

5

30

% within Gender

20.0%

10.0%

26.7%

26.7%

16.7%

100.0%


            A total of 6 respondents were of the opinion that women should weigh less and eat less, representing 20 percent of the people sampled.  However, it should be noted that a majority of women were undecided when this question was presented (33.3% = not sure) with the same proportion of males agree with this particular question. This has been clearly illustrated in the histograms in Figure 1 below. The genders are clustered together with column height representing the feedback from each view.

Figure 1: Histogram of opinions of 15 males and 15 females on whether women should weigh less and eat less.

In the questionnaire section seeking to investigate whether men should weigh more and eat more, 4/5 of the women interviewed were not sure representing 46.7% of women interviewed whereas a relatively high number of men (not sure =33.3%) were also not undecided. This is clearly illustrated in Table 2 below.

Table 2: Cross-tabulation; men weigh less and eat more

Gender  * Men should weigh more and eat more Cross tabulation


Men should weigh more and eat more

Total

Strongly disagree

Disagree

Not sure

Agree

Strongly agree

Gender

male

Count

2

3

5

4

1

15

% within Gender

13.3%

20.0%

33.3%

26.7%

6.7%

100.0%

female

Count

2

0

7

4

2

15

% within Gender

13.3%

.0%

46.7%

26.7%

13.3%

100.0%

Total

Count

4

3

12

8

3

30

% within Gender

13.3%

10.0%

40.0%

26.7%

10.0%

100.0%


Further graphical representation of the distribution of the responses from the sample is made in figure 2 below.

Figure 2: Histogram of opinions of 15 males and 15 females on whether men should weigh more and eat more.

The final section of the questionnaire sought to enquire about the food preferences of the sample group. In the results, around 80% of the male respondents preferred a variety of food and also a high number of female respondents preferred vegetables and fruits (Table 3).

Table 3: Statement that best describes food preferences.

Gender  * choose a statement that best describes your usual food preferences Cross tabulation


choose a statement that best describes your usual food preferences

Total

I prefer a variety of foods to eat

I prefer meat, fish, and poultry

I prefer fruits and vegetables

Gender

male

Count

12

2

1

15

% within Gender

80.0%

13.3%

6.7%

100.0%

female

Count

5

1

9

15

% within Gender

33.3%

6.7%

60.0%

100.0%

Total

Count

17

3

10

30

% within Gender

56.7%

10.0%

33.3%

100.0%


This sharp contrast is illustrated in the histogram below (figure 3) where a significantly low proportion of the sampled population showing a preference for meat, fish, and poultry.

Figure 3: Statement that best describes food preferences

Read More
Cite this document
  • APA
  • MLA
  • CHICAGO
(Food Preferences Analysis Social&Family Issues Example | Topics and Well Written Essays - 500 words, n.d.)
Food Preferences Analysis Social&Family Issues Example | Topics and Well Written Essays - 500 words. https://studentshare.org/medical-science/2105647-food-preferences-analysis
(Food Preferences Analysis Social&Family Issues Example | Topics and Well Written Essays - 500 Words)
Food Preferences Analysis Social&Family Issues Example | Topics and Well Written Essays - 500 Words. https://studentshare.org/medical-science/2105647-food-preferences-analysis.
“Food Preferences Analysis Social&Family Issues Example | Topics and Well Written Essays - 500 Words”. https://studentshare.org/medical-science/2105647-food-preferences-analysis.
  • Cited: 0 times
sponsored ads
We use cookies to create the best experience for you. Keep on browsing if you are OK with that, or find out how to manage cookies.
Contact Us