StudentShare
Contact Us
Sign In / Sign Up for FREE
Search
Go to advanced search...
Free

Company analysis of 1)Qatarqas transport company (Nakilat) - Research Paper Example

Cite this document
Summary
Qatarqas transport company Macroeconomic Analysis The company has a lot to contribute to the economy in terms of employment, and reduction of the inflation rates. Besides, the firm’s contribution to the GDP is immense in relation to the expenditure…
Download full paper File format: .doc, available for editing
GRAB THE BEST PAPER93% of users find it useful
Company analysis of 1)Qatarqas transport company (Nakilat)
Read Text Preview

Extract of sample "Company analysis of 1)Qatarqas transport company (Nakilat)"

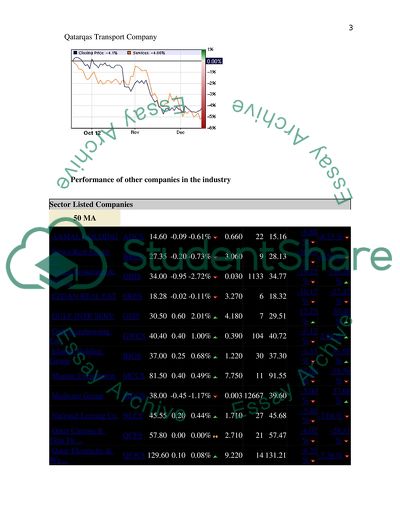
Qatarqas transport company Macroeconomic Analysis The company has a lot to contribute to the economy in terms of employment, and reduction of the inflation rates. Besides, the firm’s contribution to the GDP is immense in relation to the expenditure in transport industry. Industry Analysis QGTS vs. Qatar General Index QGTS vs. Sector Index Performance of other companies in the industry Sector Listed Companies  50 MA  AAMAL HOLDING  AHCS 14.60 -0.09 -0.61%   0.660 22 15.16 -9.88 %   -8.

75 %    Birwa Real Estate Co.  BRES 27.35 -0.20 -0.73%   3.060 9 28.13 -10.77 %   -6.50 %    Dallas Brokerage & Inve .  DBIS 34.00 -0.95 -2.72%   0.030 1133 34.77 -19.72 %   136.28 %    EZDAN REAL EST  ERES 18.28 -0.02 -0.11%   3.270 6 18.32 -10.17 %   -17.47 %    GULF INTR SERV  GISS 30.50 0.60 2.01%   4.180 7 29.51 12.75 %   30.40 %    Gulf Warehousing Co.  GWCS 40.40 0.40 1.00%   0.390 104 40.72 -0.12 %   2.28 %    Islamic Holding Group  IHGS 37.00 0.25 0.68%   1.220 30 37.30 -1.

33 %   51.95 %    Mannai Corporation  MCCS 81.50 0.40 0.49%   7.750 11 91.55 -17.68 %   -18.50 %    Medicare Group  MCGS 38.00 -0.45 -1.17%   0.003 12667 39.60 -5.00 %   37.68 %    National Leasing Co.  NLCS 45.55 0.20 0.44%   1.710 27 45.68 -5.40 %   -7.04 %    Qatar Cinema & Film Di .  QCFS 57.80 0.00 0.00%   2.710 21 57.47 -6.02 %   -29.51 %    Qatar Electricity & Wa .  QEWS 129.60 0.10 0.08%   9.220 14 131.21 -4.35 %   -7.36 %    Qatar Fuel Co.  QFLS 274.90 -0.20 -0.

07%   27.620 10 276.10 -2.69 %   12.90 %    Qatar Gas Transport Co .  QGTS 15.21 0.00 0.00%   1.050 14 15.28 -4.64 %   -13.18 %    Qatar Meat & Livestock .  QMLS 59.50 -0.40 -0.67%   1.050 57 63.50 -11.85 %   76.30 %    Qatar Navigation Co.  QNNS 63.10 0.10 0.16%   6.560 10 64.61 3.10 %   -18.16 %    QATAR OMAN INVES  QOIS 12.39 0.06 0.49%   0.690 18 12.53 1.14 %   40.48 %    Qatar Real Estate Inve .  QRES 34.20 0.00 0.00%   2.480 14 34.20 0.00 %   0.

00 %    Qatar Shipping Co.  QSHS 39.90 0.00 0.00%   2.740 15 39.90 0.00 %   0.00 %    Qatar Technical Inspec .  QTIS 31.50 0.00 0.00%   2.520 13 31.50 0.00 %   0.00 %    Qatar Telecom  QTEL 102.00 0.30 0.29%   18.950 5 104.18 -5.12 %   -31.54 %    Salam International In .  SIIS 12.50 0.00 0.00%   1.300 10 12.87 -6.79 %   3.56 %    Vodafone Qatar  VFQS 8.27 -0.03 -0.36%   N/A N/A 8.62 -8.42 %   10.27 %   Source: Gulfbase.com, 2012 From the table above it is apparent that the company’s performance in the industry is very strong in connection to the contribution it makes to the general economy.

Company Analysis Qatar gas transport company L.td. (Nakilat) is a company involved in shipping of goods and commodities. The firm offers transportation from the Northern Qatar field via its large group of vessels. The company conducts its activities through maintenance of ship yard that gives repair to ship and management services to the ships. The firm has a wide fleet of 54 LNG vessels alongside line with four main liquefied Petroleum Gas Very Large Gas Carriers (UNCTAD. Secretariat. 2007).

The firm is a joint stock firm that is owned fifty-fifty by the public and Qatari national firms. The financial ratios for the firm are highlighted in the table below. Financial Ratios for the last three years Per Share Data 2010 2011 2012 P/E 7.13 13.91 16.46 Price/Book Value 0.97 1.15 1.95 Price/Cash Flow 7.75 13.73 17.9 Earning Yield (%) 13.25 7.58 5.49 Dividends Dividend Yield (%) 1.60 2.20 3.

75 Payout Ratio (%) 32.73 36.75 40.90 Profitability Ratios (%) Net Profit Margin (%) 73.77 74.91 70.56 Rate of Returns Return On Assets (%) 1.01 0.82 1.91 Return On Equity (%) 5.39 5.79 10.13 Financial strength Current Ratio 6.21 4.57 2.33 Leverage (%) 100.2 110.29 123.4 Equity/Assets (%) 99.33 22.69 29.79 Source: Gulfbase.com, 2012 The equity per asset ratio shows the strength of the company in utilizing its invested capital to buy more non- current assets. The company also has a strong financial performance in connection to the financial ratios revealed in the table above.

Share Prices (5-Year Data) The earnings per share for Qatar gas Transport Company currently stands at 1.05 and it is projected to grow by 13% every year over the following 10 years. The firm currently has an average dividend payout ratio of 3.75% which is expected to grow steadily in the next 10 years. Earnings per Share after the 5th Year = 1.05 X (1.13 ^10) = 3.56 Forecasting for 10 years = 1.05 * 0.13= 1.1865 The firms average Price Earnings ratio has been approximately 3.56 Total Dividends = Total EPS X 3.

75% Total EPS: 1.18765 2013: 1.340745 2014: 1.5150 2015: 1.7120 The table below shows the performance of the shares in the last 52 weeks. There seems to be a falling share performance within the week but according to the moving averages the shares have been recording some slight improvement. Trading Highlights 52 WK H(18.30) L(14.52) Issued Shares 553,747,000 Market Cap(End of day) 8,422,491,870 3 months change -0.74 -4.64% 52 week change -2.31 -13.18% 52Wk H Vol/Issued Shares 4,488,831 0.81% 52Wk L Vol/Issued Shares 37,608 0.

01% 3M avg.Vol/Issued Shares 193,740 0.03% EOD Vol/Issued Shares 119,318 0.02% 200 Day Moving Average 15.63 50 Day Moving Average 15.28 Earnings Per Share (EPS) 1.05 [ Mar 2010 ] End of Day (P/E multiple) 14   Foreign Investment Permitted Country of Origin GCC Arab Foreigners Qatar No No No Source: Gulfbase.com, 2012 References UNCTAD. Secretariat. (2007). Review of maritime transport 2007: : report. New York: United Nations. Gas Processing Symposium, Benyahia, F., & Eljack, F. T. (2010). Proceedings of the 2nd Annual Gas Processing Symposium: Quatar, January 10-14, 2010.

Amsterdam: Elsevier. Gulfbase.com, 2012

Read More
Cite this document
  • APA
  • MLA
  • CHICAGO
(Not Found (#404) - StudentShare, n.d.)
Not Found (#404) - StudentShare. https://studentshare.org/marketing/1791252-company-analysis-of-1qatarqas-transport-company-nakilat
(Not Found (#404) - StudentShare)
Not Found (#404) - StudentShare. https://studentshare.org/marketing/1791252-company-analysis-of-1qatarqas-transport-company-nakilat.
“Not Found (#404) - StudentShare”. https://studentshare.org/marketing/1791252-company-analysis-of-1qatarqas-transport-company-nakilat.
  • Cited: 0 times
sponsored ads
We use cookies to create the best experience for you. Keep on browsing if you are OK with that, or find out how to manage cookies.
Contact Us