StudentShare

Our website is a unique platform where students can share their papers in a matter of giving an example of the work to be done. If you find papers
matching your topic, you may use them only as an example of work. This is 100% legal. You may not submit downloaded papers as your own, that is cheating. Also you
should remember, that this work was alredy submitted once by a student who originally wrote it.
✕
Free
Stock Market Report: International Business Machines Corporation - Research Paper Example
Summary
This report is being carried out to analyze and present a simulated stock portfolio designed to track the return on investment of a $100,000 investment in equities vs. the return of the NASDAQ, DJIA, S&P 500, and other indices as a benchmark…
- Subject: Marketing
- Type: Research Paper
- Level: High School
- Pages: 5 (1250 words)
- Downloads: 0
- Author: sophia78
Extract of sample "Stock Market Report: International Business Machines Corporation"
Stock Market Report: International Business Machines Corporation (NYSE:IBM)
This report analyzes a simulated stock portfolio designed to track the return on investment of a $100,000 investment in equities vs. the return of the NASDAQ, DJIA, S&P 500, and other indices as a benchmark. For purposes of the analysis and to test the investment strategy, $100,000 USD was invested in the common stock of IBM, the International Business Machines Corporation, with stock ticker identification of IBM (NYSE). IBM is one of the oldest American Information Technology companies, and is largely regarded as the leading company in its field. Competitors to IBM include Microsoft (MSFT), Apple (APPL), Texas Instruments (TXN), Hewlett Packard (HPQ), and other IT companies, but few other companies have the portfolio of high tech research, consulting, chip printing, and software development as IBM, therefore this stock represented my best choice of investment in relation to the terms of the project for simulation and the analysis will compare the return of this investment over a three month period, from September 1st, 2010 to Dec.1st, 2010.
Company Name:
Shares – 9/1/2010:
Shares – 12/1/2010:
International Business Machines Corp. (IBM)
795 shares purchased at cost of $125.77 per share
795 shares sold at price of $144.41 per share
Value:
$100,000 + commission
$114,805 - commission
On September 1st, 2010 – IBM’s stock price closed at: $125.77 per share.
On December 1st, 2010 – IBM’s stock price closed at: $144.41 per share.
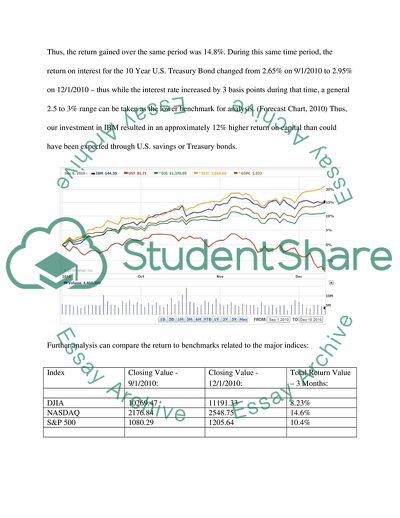
Thus, the return gained over the same period was 14.8%. During this same time period, the return on interest for the 10 Year U.S. Treasury Bond changed from 2.65% on 9/1/2010 to 2.95% on 12/1/2010 – thus while the interest rate increased by 3 basis points during that time, a general 2.5 to 3% range can be taken as the lower benchmark for analysis. (Forecast Chart, 2010) Thus, our investment in IBM resulted in an approximately 12% higher return on capital than could have been expected through U.S. savings or Treasury bonds.
Further analysis can compare the return to benchmarks related to the major indices:
Index
Closing Value - 9/1/2010:
Closing Value - 12/1/2010:
Total Return Value – 3 Months:
DJIA
10269.47
11191.33
8.23%
NASDAQ
2176.84
2548.75
14.6%
S&P 500
1080.29
1205.64
10.4%
From this it is evident that IBM tracked the NADAQ Composite Index with a correlation of 0.2% difference only. As IBM is a major component of the NASDAQ index, this is not surprising, but opens up the analysis to the benefits of ETF investing which could return similarly in terms of percentage on capital invested as IBM, yet could eliminate the risk inherent with all capital invested in one company. An example of this type of investment would be in the ETF PowerShares QQQ Trust, Series 1 (NASDAQ:QQQQ). (Invesco, 2010)
Analysis:
1. The investment in IBM was intended to return results higher than savings account investment, U.S. Treasury Bond investment, and Index based investment. The investment in IBM did outperform savings and treasury bonds, and also the DJIA and S&P 500 Indexes. However, the correlation to NASDAQ Index return was 0.2% variance only.
2. I had considered that IBM may outperform the NADAQ in a stronger manner, for in returning near index tracking equivalencies, there may be other safer investments for the same return, or examples of higher risk investments that can generate a greater return.
3. For Analysts, the major development of the quarter was IBM’s reaffirmation of earnings guidelines for the year: “IBM Corporation announced that it is uniquely positioned in the enterprise, investing in high value segments like business analytics, advanced systems and smarter planet solutions. As a result, the Company is confident it can deliver strong business performance to grow profit, return value to its shareholders and to achieve fiscal 2010 diluted earnings per share (EPS) of at least $11.40. According to Reuters Estimates, analysts were expecting the Company to report EPS of $11.30 for fiscal 2010.” (Reuters, 2010)
4. During the Quarter, IBM announced a number of new contracts including with medical groups like Columbia Medical Center, Government-level as with India, Telecom sector alliances with other corporations, and Defense/Space Industry contracts. These boosted the stock price on a daily level but did not average to be significantly important in Alpha calculations. The company also acquired two companies, Blade Technologies and Netezza, adding intellectual property and new business sectors in Cloud Computing. IBMs continued development in the Cloud Computing sector is establishing new cash flows. “Just a week after the tech giant's $1.7 billion purchase of data warehousing specialist Netezza (NZ), IBM continues to throw money round like confetti, snapping up privately-held Blade Network Technologies for a rumored $400 million.” (Rogers, 2010)
5. Portfolio Management Websites:
The websites I find most helpful for portfolio management are:
Google Finance - http://www.google.com/finance
I use Google Finance for live Stock prices as well as for historical data and news filtering related to stock research.
Yahoo Finance - http://finance.yahoo.com
I use Yahoo Finance for Chart Analysis primarily, and also for quick access to SEC reports, Insider Holdings, Major Holders, and Analysts’ target price.
Seeking Alpha - http://seekingalpha.com
Seeking Alpha is a community of bloggers, traders, analysts, accountants, hedge fund managers sharing information related to the market and investments.
WSJ Market Watch – http://www.marketwatch.com/
This site is good for current events, breaking news, discussion of issues, interviews, etc.
The Street – http://www.thestreet.com
This site is related to Jim Cramer and his company but is good also for some perspective on company news and business management, as well as market analysis.
Sources:
Forecast Charts. (2010). 10 Year Treasury Rate Forecast. Signal Trend Inc. Date accessed Dec. 12th, 2010:
Hagstrom, Robert G.. (1999). The Warren Buffett Portfolio: Mastering the Power of the Focus Investment Strategy. New York, NY: John Wiley & Sons, 1999.
Invesco (2010). PowerShares QQQ. Invesco PowerShares Capital Management LLC. Date accessed Dec. 12th, 2010:
Jain, Prem. (2010). Buffett Beyond Value: Why Warren Buffett Looks to Growth and Management When Investing. Hoboken, NJ: John Wiley & Sons Press, 2010.
Loughridge, Mark. (2010). Executive presentations: Webcasts of events made by top IBM executives.. IBM Investor relations. Date accessed Dec. 12th, 2010:
Reuters Estimates. (2010). INTERNATIONAL BUSINESS MACHINES CORPORATION (IBM). Reuters News - Key Developments. Date accessed Dec. 12th, 2010:
Rogers, James. (2010). IBM Flashes Blade Acquisition. The Street (9/27/10). Date accessed Dec. 12th, 2010: < http://www.thestreet.com/story/10872180/1/ibm-flashes-blade-acquisition.html>
Read
More
sponsored ads
Save Your Time for More Important Things
Let us write or edit the research paper on your topic
"Stock Market Report: International Business Machines Corporation"
with a personal 20% discount.
GRAB THE BEST PAPER
