StudentShare
Contact Us
Sign In / Sign Up for FREE
Search
Go to advanced search...
Free

Applied Quantitative Methods for Business in China - Assignment Example

Cite this document
Summary
The initial task for "Applied Quantitative Methods for Business in China" was to calculate the new CPI for the years 1986 to 1997 using 1978 as the base year. The new CPI was therefore calculated and is mentioned in the table…
Download full paper File format: .doc, available for editing
GRAB THE BEST PAPER96.4% of users find it useful
Applied Quantitative Methods for Business in China
Read Text Preview

Extract of sample "Applied Quantitative Methods for Business in China"

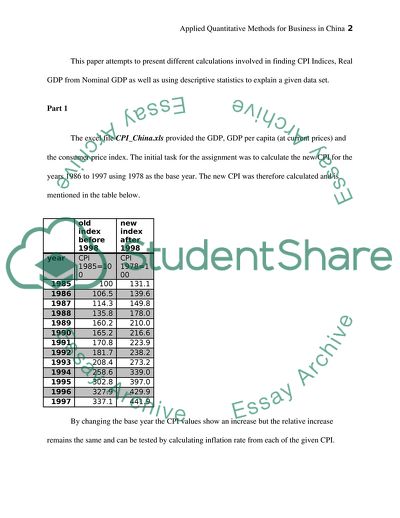
Applied Quantitative Methods for Business in China Inserts His/Her Word Count 1968 Inserts Grade Inserts Tutor’s Name Writer Inserts Date Here (Day, Month, Year) This paper attempts to present different calculations involved in finding CPI Indices, Real GDP from Nominal GDP as well as using descriptive statistics to explain a given data set. Part 1 The excel file CPI_China.xls provided the GDP, GDP per capita (at current prices) and the consumer price index. The initial task for the assignment was to calculate the new CPI for the years 1986 to 1997 using 1978 as the base year. The new CPI was therefore calculated and is mentioned in the table below.   old index before 1998 new index after 1998 year CPI 1985=100 CPI 1978=100 1985 100 131.1 1986 106.5 139.6 1987 114.3 149.8 1988 135.8 178.0 1989 160.2 210.0 1990 165.2 216.6 1991 170.8 223.9 1992 181.7 238.2 1993 208.4 273.2 1994 258.6 339.0 1995 302.8 397.0 1996 327.9 429.9 1997 337.1 441.9 By changing the base year the CPI values show an increase but the relative increase remains the same and can be tested by calculating inflation rate from each of the given CPI. Old CPI with 1985 base year The second task was to calculate the old CPI using the values provided for the new CPI. These are mentioned in the table below.   old index before 1998 new index after 1998 Year CPI 1985=100 CPI 1978=100 1998 334.4 438.4 1999 329.7 432.2 2000 331.0 434.0 2001 333.3 437.0 2002 330.7 433.5 2003 334.6 438.7 2004 347.7 455.8 2005 353.9 464.0 2006 359.3 471.0 2007 376.5 493.6 2008 398.7 522.7 2009 395.9 519.0 The third task was to change the base year to 2000 for the given index and it has been calculated by setting CPI for the year 2000 to be equal to 100. The Index thus generated is given below.   Old index before 1998 New index after 1998 year CPI 1985=100 CPI 1978=100 CPI 2000=100 1985 100 131.1 30.2 1986 106.5 139.6 32.2 1987 114.3 149.8 34.5 1988 135.8 178.0 41.0 1989 160.2 210.0 48.4 1990 165.2 216.6 49.9 1991 170.8 223.9 51.6 1992 181.7 238.2 54.9 1993 208.4 273.2 63.0 1994 258.6 339.0 78.1 1995 302.8 397.0 91.5 1996 327.9 429.9 99.0 1997 337.1 441.9 101.8 1998 334.4 438.4 101.0 1999 329.7 432.2 99.6 2000 331.0 434.0 100.0 2001 333.3 437.0 100.7 2002 330.7 433.5 99.9 2003 334.6 438.7 101.1 2004 347.7 455.8 105.0 2005 353.9 464.0 106.9 2006 359.3 471.0 108.5 2007 376.5 493.6 113.7 2008 398.7 522.7 120.4 2009 395.9 519.0 119.6 It appears from the result that by CPI increases successively in each year no matter what base year has been set up apart from some observations i.e. for the year 1998, 1999, 2002 and 2009. These findings can be confirmed by calculating the inflation rate. Since the CPI for years 1985 to 2009 has been calculated. The next task was to calculate the inflation rate. The inflation rate for each year has been calculated and is enlisted in the following table.   old index before 1998 new index after 1998 year CPI 1985=100 CPI 1978=100 CPI 2000=100 Inflation rate 1985 100 131.1 30.2   1986 106.5 139.6 32.2 7% 1987 114.3 149.8 34.5 7% 1988 135.8 178.0 41.0 19% 1989 160.2 210.0 48.4 18% 1990 165.2 216.6 49.9 3% 1991 170.8 223.9 51.6 3% 1992 181.7 238.2 54.9 6% 1993 208.4 273.2 63.0 15% 1994 258.6 339.0 78.1 24% 1995 302.8 397.0 91.5 17% 1996 327.9 429.9 99.0 8% 1997 337.1 441.9 101.8 3% 1998 334.4 438.4 101.0 -1% 1999 329.7 432.2 99.6 -1% 2000 331.0 434.0 100.0 0% 2001 333.3 437.0 100.7 1% 2002 330.7 433.5 99.9 -1% 2003 334.6 438.7 101.1 1% 2004 347.7 455.8 105.0 4% 2005 353.9 464.0 106.9 2% 2006 359.3 471.0 108.5 2% 2007 376.5 493.6 113.7 5% 2008 398.7 522.7 120.4 6% 2009 395.9 519.0 119.6 -1% The inflation rate values confirm our findings that the country faced deflation in the years 1998, 1999, 2002 and 2009. Moreover the rate was very high for the year 1994. The inflation rate for year 1985 was not calculated due to unavailability of the CPI for the preceding year. The next task was to calculate the values of Real GDP and GDP per capita at the 2000 price. These have been calculated for the given period and enlisted in the table below.   GDP at current prices at current prices Real GDP(100 Million Yuan) Real GDP per capita (Yuan) year GDP (100 million Yuan) per capita GDP (Yuan) CPI 2000=100 At 2000 Prices At 2000 Prices 1985 9016.0 858 30.2 29847.1 2839.8 1986 10275.2 963 32.2 31939.4 2994.0 1987 12058.6 1112 34.5 34925.1 3221.8 1988 15042.8 1366 41.0 36670.5 3328.7 1989 16992.3 1519 48.4 35113.7 3138.9 1990 18667.8 1644 49.9 37408.5 3294.4 1991 21781.5 1893 51.6 42217.0 3668.6 1992 26923.5 2311 54.9 49052.7 4210.6 1993 35333.9 2998 63.0 56128.2 4762.9 1994 48197.9 4044 78.1 61700.2 5176.9 1995 60793.7 5046 91.5 66464.5 5516.4 1996 71176.6 5846 99.0 71859.3 5902.0 1997 78973.0 6420 101.8 77554.5 6304.9 1998 84402.3 6796 101.0 83555.2 6727.8 1999 89677.1 7159 99.6 90050.5 7188.3 2000 99214.6 7858 100.0 99214.6 7857.7 2001 109655.2 8622 100.7 108902.4 8562.5 2002 120332.7 9398 99.9 120471.5 9408.9 2003 135822.8 10542 101.1 134367.6 10429.0 2004 159878.3 12336 105.0 152231.7 11745.6 2005 184937.4 14185 106.9 172980.2 13268.2 2006 216314.4 16500 108.5 199321.6 15203.5 2007 265810.3 20169 113.7 233714.9 17734.1 2008 314045.4 23708 120.4 260753.2 19684.6 2009 340506.9 25575 119.6 284739.8 21386.8 The real GDP values show the impact of inflation on the nominal GDP. Since the Real GDP values have been calculated the annual GDP growth rate can be calculated and is listed below. Real GDP(100 Million Yuan) Real GDP per capita (Yuan) Year At 2000 Prices At 2000 Prices Annual Real GDP growth rate 1985 29847.1 2839.8   1986 31939.4 2994.0 7% 1987 34925.1 3221.8 9% 1988 36670.5 3328.7 5% 1989 35113.7 3138.9 -4% 1990 37408.5 3294.4 7% 1991 42217.0 3668.6 13% 1992 49052.7 4210.6 16% 1993 56128.2 4762.9 14% 1994 61700.2 5176.9 10% 1995 66464.5 5516.4 8% 1996 71859.3 5902.0 8% 1997 77554.5 6304.9 8% 1998 83555.2 6727.8 8% 1999 90050.5 7188.3 8% 2000 99214.6 7857.7 10% 2001 108902.4 8562.5 10% 2002 120471.5 9408.9 11% 2003 134367.6 10429.0 12% 2004 152231.7 11745.6 13% 2005 172980.2 13268.2 14% 2006 199321.6 15203.5 15% 2007 233714.9 17734.1 17% 2008 260753.2 19684.6 12% 2009 284739.8 21386.8 9% The annual real GDP of China has been found to be increasing successively during the period 2000-2007. However, it remained stagnant during the period 1995-1999 while declined during 1987-1989 and after 2007. The last task involving this data file was to calculate the real GDP Index for the period 1985 to 2009. The values of GDP Index provide the relative annual GDP as compared to that of year 1985 (Tucker, 2010). Real GDP index Year GDP 1985=100 1985 100 1986 107.0 1987 117.0 1988 122.9 1989 117.6 1990 125.3 1991 141.4 1992 164.3 1993 188.1 1994 206.7 1995 222.7 1996 240.8 1997 259.8 1998 279.9 1999 301.7 2000 332.4 2001 364.9 2002 403.6 2003 450.2 2004 510.0 2005 579.6 2006 667.8 2007 783.0 2008 873.6 2009 954.0 Part 2 Using the excel file Population-China.xls that provided a national sample survey on Chinas population by Age and Gender in 2009, certain percentages were to be calculated. It also provides the data of national sample survey on Chinas population by Age in 1995. So in order to calculate the percentages of each group the figures for the male, female and population in each group was divided by the total population in 2009 and multiplied with 100. The percentages were thus found to be. Age Male Female Population 2009 0-9 6% 5% 11% 10-19 7% 6% 13% 20-29 7% 7% 14% 30-39 8% 8% 16% 40-49 9% 9% 18% 50-59 7% 7% 14% 60-69 4% 4% 8% 70-79 2% 2% 5% 80-89 1% 1% 1% 90+ 0.04% 0.09% 0.13% Total 51% 49% 100% The overall results show that during 2009, male constituted 51% of the total population of China, while female constituted 49%. Thus it can be said that most of the population reported in 2009 were male and were found to be between 40-49 years of age depicting the aging population. Row Percentages 2009 Age Male Female 0-9 55% 45% 10-19 53% 47% 20-29 50% 50% 30-39 49% 51% 40-49 50% 50% 50-59 50% 50% 60-69 51% 49% 70-79 50% 50% 80-89 43% 57% 90+ 30% 70% Total 51% 49% When the male female ratio was calculated using the total population in each group the results showed that below 19 years, the majority of population were male, while the ratio was equal for the age groups 40-49, 50-59 and 70-79. However the ratio of female was found to be greater for the age groups 30-39, 80-89 and 90+. Thus most of the aging population of China was consisting of females in 2009. Column Percentages 2009 Age Male Female 0-9 11% 10% 10-19 14% 13% 20-29 14% 14% 30-39 15% 16% 40-49 17% 18% 50-59 14% 14% 60-69 8% 8% 70-79 5% 5% 80-89 1% 2% 90+ 0% 0% Total 100% 100% The results for the proportion of population of each gender in each age group showed that majority of the males in China were found to be 0-59 years and the similar was seen for the females. However the major section of each gender was found to be between 40-49 (middle age) and showing an alarming condition for the Chinese economy by the soon increasing aging population. Population 1995 Age Population 1995 0-9 18% 10-19 16% 20-29 19% 30-39 16% 40-49 13% 50-59 8% 60-69 6% 70-79 3% 80-89 1% 90+ 0% Total 100% When the percentages for each age group was calculated for the year 1995, it was found that during 1995 survey, the major section of the population was between 20-29 age which were found to be among middle ages when the proportions were calculated for the year 2009 population data. Graphical Representation The graph also shows that the major proportion of male and female population were between 40-49 age group in year 2009. This graph illustrates that the male proportion of population were higher than female in age groups 0-9, 10-19, and 60-69 while the female proportion was higher in the age groups 30-39, 80-89 and 90+. Besides the male and female was found to be equal constituents of the population for the age groups 20-29, 40-49 and 70-79. Descriptive Statistics   Population 2009 Population 1995       Mean 116498.4 1236695.2 Standard Error 22587.33 283138.7038 Median 140016.5 1301021.5 Mode #N/A #N/A Standard Deviation 71427.41 895363.1979 Sample Variance 5.1E+09 8.01675E+11 Kurtosis -1.1221 -1.768908023 Skewness -0.56573 -0.178852892 Range 203240 2330901 Minimum 1482 7510 Maximum 204722 2338411 Sum 1164984 12366952 Count 10 10 Since the descriptive statistics for the given data have been calculated using MS Excel 2007, so the manual calculation were avoided. Besides the formulae for manual calculations are listed below For Arithmetic mean For Standard Deviation (σ) and Variance (σ2) The total number of classes was 10 and hence the calculation utilized it for the sake of finding statistics (Black, 2009). Mean total population in each age group is found to be 116498 for the year 2009 while it is 1236695 for the year 1995. Thus the population has declined during the period 1995-2009. The standard deviation shows that each group population may vary from the mean by 71427 for 2009 while by 895363 for 1995 (Mann, 2010). References Black, K. (2009). Business Statistics: Contemporary Decision Making. 6th ed. John Wiley & Sons, 2009 Tucker, I. B. (2010). Survey of Economics. 7th ed. Cengage Learning. Mann, P. S. (2010). Introductory Statistics.7th ed. John Wiley & Sons. Read More
Cite this document
  • APA
  • MLA
  • CHICAGO
(Applied Quantitative Methods for Business in China Assignment, n.d.)
Applied Quantitative Methods for Business in China Assignment. https://studentshare.org/macro-microeconomics/1792287-applied-quantitative-methods-for-business-in-china
(Applied Quantitative Methods for Business in China Assignment)
Applied Quantitative Methods for Business in China Assignment. https://studentshare.org/macro-microeconomics/1792287-applied-quantitative-methods-for-business-in-china.
“Applied Quantitative Methods for Business in China Assignment”. https://studentshare.org/macro-microeconomics/1792287-applied-quantitative-methods-for-business-in-china.
  • Cited: 0 times

CHECK THESE SAMPLES OF Applied Quantitative Methods for Business in China

Challenges of International Apparel Brands in Penetrating China

The case is the same in context to the international clothing brands expanding in china.... china as a growing economy is seen as the prospect for the foreign brands to explore the country.... china as a growing economy is seen as the prospect for the foreign brands to explore the country.... china is said to be the land of opportunity and to analyse its true nature the paper has focused on the implication of Chinese culture and what international brands requires to be a part of the Chinese business market....
14 Pages (3500 words) Essay

Effects of Globalization on the US Steel Producers

In this milieu, china, Europe and India are recognised as the major receivers of the US made steels (American Institute for International Steel, Inc, 2009).... Besides producing steel, it is also involved in other business activities, such as developing transportaion via rail and barge operations (United States Steel Corporation, 2007)....
8 Pages (2000 words) Research Paper

Chinas automobile industry Chapter 1 and 3

On top of having a significant increase… Considering the success of China's automobile industry, this report will focus on identifying, analysing, and concluding whether or not the Started in 1984, the first wave of investment in the automobile industry in china includes the establishment of Beijing Jeep and Shanghai Volkswagen (Wu, 2006).... In 2009, the total number of cars, trucks and other vehicles sold in china was 13.... he main objective of this study is to gather existing and most current literature regarding the degree of competition in china's automobile industry....
4 Pages (1000 words) Essay

Research Methodological Approaches

hellip; The paper tells that the qualitative and quantitative methods have been in use for quite a long time and studies done in the 1980s relied upon either of the two.... This research is being carried out to evaluate and present qualitative, quantitative and mixed methods as the three common approaches used by scholars.... The mixed methods are also gaining recognition and wide application in studies since they act as a bridge for the gap existing between qualitative and quantitative approaches....
7 Pages (1750 words) Essay

Impact of capital structure on financial performance of real estate firms listed in Chinese

Guo and Huang (2010) scrutinized the association between stock market and real estate market in china and recognized unidirectional relationship thereof.... Geographically, china represents 78.... eal estate industry has n considered as a prominent industrial pillar of the national economy of china as it has fully impacted the employment, labour productivity, savings and total investment.... Market analysis suggest that on average the Asia-Pacific real estate industry has witnessed growth of 13 percent between 2009 and 2013 while china alone witnessed growth as high as 16....
4 Pages (1000 words) Essay

Multinational Corporations and Joint Ventures in China

This paper, Multinational Corporations and Joint Ventures in china, will not endeavor in producing analyses on the subject matter that will support the argument aforementioned.... nbsp;Multinational Corporations and Joint Ventures in china have an impact on the country's development.... nbsp;… This research paper will attempt to examine the impact of the distinct Chinese culture on the human resources management to the international management of Multi-National Corporations (MNC) and Joint Ventures (JV) in china....
25 Pages (6250 words) Case Study

Effects of Globalization on the US Steel Producers

Besides producing steel, it is also involved in other business activities, such as developing transportation via rail and barge operations (United States Steel Corporation, 2007).... The global steel manufacturing companies have adopted the techniques which are already implied by US steel producers in order to gain benefits… Notably, any particular analysis is not required for a qualitative research, unlike the quantitative method.... For instance, manufacturing quantitative method uses statistical tools for data analysis but in qualitative research method statistical tools are not relevant....
6 Pages (1500 words) Research Paper

The Brand of Leisure Hotel and Chinese Customers

Both the business travelers and leisure travelers from china are identified to consider the brands of leisure hotels while choosing the hotels.... This research paper "The Brand of Leisure Hotel and Chinese Customers" finds out whether the leisure hotel brands are important for the Chinese outbound tourists for making their accommodation decisions....
25 Pages (6250 words) Research Paper
sponsored ads
We use cookies to create the best experience for you. Keep on browsing if you are OK with that, or find out how to manage cookies.
Contact Us