StudentShare
Contact Us
Sign In / Sign Up for FREE
Search
Go to advanced search...
Free

Consumption expenditure - Coursework Example

Cite this document
Summary
Consumption is the expense disposed on the services and goods. There are a number of determinants that affect the short-run consumption expenditure. Some of these determinants include disposable income, consumer confidence and the wealth effect.

Download full paper File format: .doc, available for editing
GRAB THE BEST PAPER97.1% of users find it useful
Consumption expenditure
Read Text Preview

Extract of sample "Consumption expenditure"

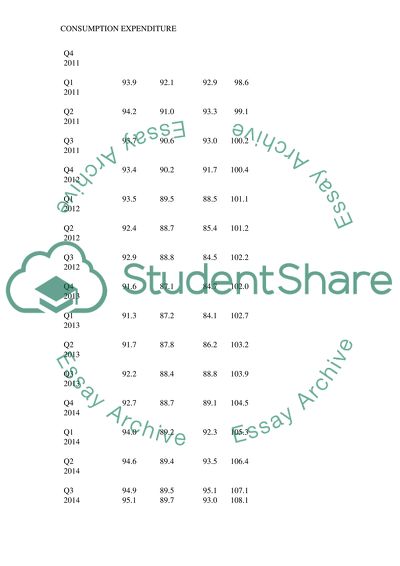
CONSUMPTION EXPENDITURE Question The following data represents the out put of quarterly distribution (GDP) in the United Kingdom from 2008 to 2014 (Attanasio & Weber, 1994, p.56). The areas of consumption are manufacturing, production, construction and services within the United Kingdom Data Table Manufacturing Production Construction Services 2008 Q1 100 100 100 100 2008 Q2 98.6 99.2 98.9 100 2008 Q3 97.1 97.6 96.1 98.8 2008 Q4 92.7 93.4 90.4 97.3 2009 Q1 87.4 89.1 84.0 96.3 2009 Q2 87.8 89.4 82.9 96.0 2009 Q3 87.6 88.4 84.4 96.1 2009 Q4 89.0 89.3 83.4 96.3 2010 Q1 90.1 90.7 87.0 96.7 2010 Q2 91.7 91.7 91.3 97.4 2010 Q3 93.0 91.8 93.7 98.1 2010 Q4 93.8 92.8 91.1 98.1 2011 Q1 93.9 92.1 92.9 98.6 2011 Q2 94.2 91.0 93.3 99.1 2011 Q3 93.7 90.6 93.0 100.2 2011 Q4 93.4 90.2 91.7 100.4 2012 Q1 93.5 89.5 88.5 101.1 2012 Q2 92.4 88.7 85.4 101.2 2012 Q3 92.9 88.8 84.5 102.2 2012 Q4 91.6 87.1 84.7 102.0 2013 Q1 91.3 87.2 84.1 102.7 2013 Q2 91.7 87.8 86.2 103.2 2013 Q3 92.2 88.4 88.8 103.9 2013 Q4 92.7 88.7 89.1 104.5 2014 Q1 94.0 89.2 92.3 105.3 2014 Q2 94.6 89.4 93.5 106.4 2014 Q3 94.9 89.5 95.1 107.1 2014 Q4 95.1 89.7 93.0 108.1 Question 2 The following is the Scatter Diagram of the output of distribution Question 3 The following table represents the best line of fit of the scatter diagram. Question 4 The diagrams above indicate the GDP path and its headline industries that relates to the output level attained in quarterly manner (three months). In the decade preceding the downturn, the service industry had grown gradually, while the output production was flat within the same period (Stone, Rowe, Corlett, Hurstfield, & Potter, 1954, p.76). Construction developed sturdily in the initial part of the decade and while there was a momentary deterioration in mid-2000s, in 2007, this reversed. Industries have exhibited various inclinations after the last economic downturn. The production, manufacturing and construction industries were heavily affected by the decline of economic conditions. In contrast, the output of the service industry declined by four percent from its peak to trough (Symons, Proops & Gay, 1994, p.83). Production began to develop in 2010, and the construction and manufacturing industries exhibited a similar strength, and none of the industries showed a sustained growth. The output of production dropped in 2011 and 2012. In 2012, the output of construction dropped sharply. In 2014, the output of construction improved. However, the output dropped in the recent quarter. While there has been a prevalent development across the sections of GDP since the beginning of 2013, the service industry still remains to be the steadiest and the largest contributor to the economic development, and is the only headline industry, where the output has passed the levels of pre-downturn. The United Kingdom experienced a marginally slower standard compound growth of GDP in five years after the economic downturn; this is also the same for the service industry. In quarter four of 2014, only the production and service industry outperformed the post-downturn growth rates of the headline industry. Within the insurance, financial and service industries have exhibited certain strengths when compared to the 5-year average. The development in services has also been supported by the accommodation and service industries. Question 5 Consumption is the expense disposed on the services and goods. There are a number of determinants that affect the short-run consumption expenditure. Some of these determinants include disposable income, consumer confidence and the wealth effect. Disposable income- the tendency of spending The theory of spending states that consumers will always spend money depending on what they earn (their disposable income) (Jackson & Marks, 1999, p.43). Disposable income is the income got after the welfare benefits and the taxes have been considered. The most important thing is the rate at which the consumers spend when their income increases (marginal propensity of consumption). For instance is a consumer gets an extra income of $200 and spends $150, the marginal propensity of consumption would be $150/$200, which comes to 0.75. People who have lower incomes always have a higher propensity of spending. Consumer confidence The confidence of the consumer is always measured using surveys (Muellbauer, 1994, p.74). In the United Kingdom, the credit crunch occurred in 2008 and the recession in 2009; this dropped the consumer confidence. Therefore, it means that the consumers must be confident in purchasing a particular product. Wealth effect Wealth signifies the value of assets owned by an individual or group of people. For a number of people, the value of wealth they hold is in the form of shares, property or savings in a bank. Economists believe that the wealthier an individual they higher the chance of consumption. Reference: Attanasio, O. P., & Weber, G. (1994). Is consumption growth consistent with intertemporal optimization? Evidence from the consumer expenditure survey (No. w4795). National Bureau of Economic Research. Jackson, T., & Marks, N. (1999). Consumption, sustainable welfare and human needs—with reference to UK expenditure patterns between 1954 and 1994. Ecological Economics, 28(3), 421-441. Muellbauer, J. (1994). The assessment: consumer expenditure. Oxford Review of Economic Policy, 1-41. Symons, E., Proops, J., & Gay, P. (1994). Carbon taxes, consumer demand and carbon dioxide emissions: a simulation analysis for the UK. Fiscal Studies, 15(2), 19-43. Stone, R., Rowe, D. A., Corlett, W. J., Hurstfield, R., & Potter, M. (1954). The measurement of consumers expenditure and behaviour in the United Kingdom, 1920-1938 (Vol. 1). Cambridge: Cambridge University Press. Read More
Cite this document
  • APA
  • MLA
  • CHICAGO
(“Consumption expenditure Coursework Example | Topics and Well Written Essays - 1000 words”, n.d.)
Consumption expenditure Coursework Example | Topics and Well Written Essays - 1000 words. Retrieved from https://studentshare.org/macro-microeconomics/1686435-consumption-expenditure
(Consumption Expenditure Coursework Example | Topics and Well Written Essays - 1000 Words)
Consumption Expenditure Coursework Example | Topics and Well Written Essays - 1000 Words. https://studentshare.org/macro-microeconomics/1686435-consumption-expenditure.
“Consumption Expenditure Coursework Example | Topics and Well Written Essays - 1000 Words”, n.d. https://studentshare.org/macro-microeconomics/1686435-consumption-expenditure.
  • Cited: 0 times

CHECK THESE SAMPLES OF Consumption expenditure

Economic data analysis

Similarly, if we are dealing with cross-sectional data involving regression of family Consumption expenditure on family income, the effect of an increase of one family's income on its Consumption expenditure is not expected to affect the Consumption expenditure of another family.... Similarly, if we are dealing with cross-sectional data involving regression of family Consumption expenditure on family income, the effect of an increase of one family's income on its Consumption expenditure is not expected to affect the Consumption expenditure of another family....
5 Pages (1250 words) Essay

Correlation and regression and time series analysis

48) with Household final Consumption expenditure.... Variables: The following variables were used during the analysis: Consumer Expenditure on Food and non-alcoholic beverages, measured in million Consumer Expenditure on Alcoholic beverages and tobacco, measured in million Consumer Expenditure on Clothing and Footwear, measured in million Consumer Expenditure on Housing, water, electricity, gas and other fuels in million Consumer Expenditure on Furnishings, household equipment and routine maintenance in million Consumer Expenditure on Transport in million Household final Consumption expenditure in million Best Predictor of Household Final Consumption expenditure: By calculating the correlation coefficients, it was found that consumer expenditure on Housing, water, electricity, gas and other fuels have the highest positive correlation (0....
2 Pages (500 words) Lab Report

Financial Econometrics Coursework

% of the dependent variable: real Consumption expenditure as indicated by the value of the adjusted-R Squared.... The interpretation of the regression slope coefficient is the average change in the dependent variable: real total expenditure on food for a unit increase in the independent variable: Real total expenditure on goods and services.... 2, thus for every 1 unit change in real total expenditure on goods and services, there is a 0....
3 Pages (750 words) Essay

How Equilibrium Is Determined in the Keynesian Income Expenditure Model

he aggregate effective demand is composed of planned real aggregate Consumption expenditure (C), planned real aggregate investment (I) and real aggregate government expenditure (G).... Real aggregate Consumption expenditure is assumed to be a function of real aggregate output (Y) such that if Y rises C also rises but less than proportionally.... This decline in real output again leads to a fall in real aggregate Consumption expenditure which in turn reduces effective demand again....
1 Pages (250 words) Essay

Econometric Project for final year undergraduate student

A study was carried out to determine whether an increase in real consumption expenditures, real domestic investment, government expenditures, personal disposable income, taxes and net exports has significant effect on the GDP growth.... In this case, GDP was taken as a dependent variables with, real consumption expenditures, domestic exports – imports as the within subject factors.... From the analyzed results, the variables real consumption expenditures, real gross private domestic investment, real government expenditures, real net taxes, and real net exports i....
12 Pages (3000 words) Essay

Australian Wine Exports to the Market of the USA

Under the Aggregate expenditure Model:If Australia maintains a strong currency, its trading partners will be discouraged to buy Australian exports.... Since X is an important determinant in the Aggregate expenditure of an economy, a decrease in X causes the AE of Australia to fall....
6 Pages (1500 words) Assignment

The Consumption Function

In contrary, the vital components that explain the Consumption expenditure are majorly wealth, disposable income , expected in… The effects of the increment and decrement of the interest rate on Consumption expenditure is notable in cases of Angola and Algeria.... % interest rate against Angola which has 8% interest rate The Consumption Function According to UN data, most countries have considered Consumption expenditure as the most tangible element of the gross domestic product (GDP)....
1 Pages (250 words) Research Paper

Aggregate Demand and Its Components

It consists of:Consumption expenditure depends on the real income of the household.... An increase in the real income of the household leads to an increase in the Consumption expenditure and a reduction in the real income of the household results in a reduction in Consumption expenditure.... When the income increases, people will increase their Consumption expenditure but not the whole income.... In other words, Consumption expenditure is a function of income....
6 Pages (1500 words) Essay
sponsored ads
We use cookies to create the best experience for you. Keep on browsing if you are OK with that, or find out how to manage cookies.
Contact Us