StudentShare
Contact Us
Sign In / Sign Up for FREE
Search
Go to advanced search...
Free

Economic performance of Russia and India (2010-2012) - Essay Example

Cite this document
Summary
This paper provides comparative analysis of Russia’s and India’s Economic Performance( 2010-2012) Key economic indicators are used to determine the overall economic performance of a country. Their usage also allow to detect whether there is economic growth in each country…
Download full paper File format: .doc, available for editing
GRAB THE BEST PAPER91.2% of users find it useful
Economic performance of Russia and India (2010-2012)
Read Text Preview

Extract of sample "Economic performance of Russia and India (2010-2012)"

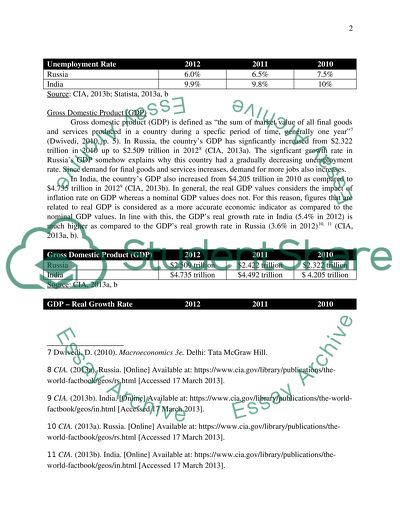
? A Comparative Analysis of Russia’s and India’s Economic Performance over the Last Three Years Module Seminar Teacher’s Date Introduction Key economic indicators are commonly used to determine the overall economic performance of a country. Using marcro-economic indicators such as unemployment rate, inflation rate, and balance of payment among others, it is possible to detect whether or not there is an economic growth in each country. Economic growth is defined as “the increase in our production of goods and services that occurs over time long periods of time”1 (Hall and Lieberman, 2010, p. 122). This report is basically composed of two (2) major parts. The firts part will focus on applying and discussing the significance of marcro-economic indicators such as unemployment rate, inflation rate, balance of payment, exchange rate, and growth indicators like gross domestic product (GDP) in the case of Russia and India. Based on news articles published by Reuters, the second part will focus on discussing the domestic and foreign factors which triggers fluctuations in some of these economic indicators. Unemployment Rate Unemployment rate is defined as “the number of unemployed people who want to have a job but do not have one”2 (Kennedy, 2000, p. 36). In line with this, Vanita (2010, p. 348) clearly explained that “one of the main objective of macroeconomic policy is not only to achieve full employment but also to maintain it at that level”3. In Russia, the unemployment rate has significantly decreased from 7.5% in 2010 down to 6.0% in 20124, 5 (CIA, 2013b; Statista, 2013a). This is a good economic indicator suggesting that the business opportunity in this country has been increasing over the past three years. This partly explains why more jobs are being offered to people who are looking for a stable job. As compared to 2010 economic data, the unemployment rate in India decreased only by 1% in 20126 (Statista, 2013b). Specifically these figures strongly suggest that there is less business opportunity in this country. (See Appendix I – Unemployment Rate in Russia between 2003 to 2013 on page 15; Appendix II – Appendix II – Unemployment Rate in India between 2010 to 2012 on page 16) Unemployment Rate 2012 2011 2010 Russia 6.0% 6.5% 7.5% India 9.9% 9.8% 10% Source: CIA, 2013b; Statista, 2013a, b Gross Domestic Product (GDP) Gross domestic product (GDP) is defined as “the sum of market value of all final goods and services produced in a country during a specfic period of time, generally one year”7 (Dwivedi, 2010, p. 5). In Russia, the country’s GDP has signficantly increased from $2.322 trillion in 2010 up to $2.509 trillion in 20128 (CIA, 2013a). The signficant growth rate in Russia’s GDP somehow explains why this country had a gradually decreasing unemployment rate. Since demand for final goods and services increases, demand for more jobs also increases. In India, the country’s GDP also increased from $4.205 trillion in 2010 as compared to $4.735 trillion in 20129 (CIA, 2013b). In general, the real GDP values considers the impact of inflation rate on GDP whereas a nominal GDP values does not. For this reason, figures that are related to real GDP is considered as a more accurate economic indicator as compared to the nominal GDP values. In line with this, the GDP’s real growth rate in India (5.4% in 2012) is much higher as compared to the GDP’s real growth rate in Russia (3.6% in 2012)10, 11 (CIA, 2013a, b). Gross Domestic Product (GDP) 2012 2011 2010 Russia $2.509 trillion $2.422 trillion $2.322 trillion India $4.735 trillion $4.492 trillion $ 4.205 trillion Source: CIA, 2013a, b GDP – Real Growth Rate 2012 2011 2010 Russia 3.6% 4.3% 4.3% India 5.4% 6.8% 10.1% Source: CIA, 2013a, b The per capita real GDP is part of the macroeconomic indicator that focuses on dividing the real GDP with the number of population in each country12 (Boyes and Melvin, 2013, p. 359). As of 2013, the total population in Russia is only 141.44 million as compared to India’s total population of 1,239.23 million13, 14 (Statista, 2013e, f). Even though there was a significant increase in India’s GDP and GDP’s real growth rate, one can say that this country is still having more economic problems as compared to Russia. First of all, despite having a larger population, India’s per capita real GDP is only $3,900 as compared to Russia’s per capita real GDP of $17,70015, 16 (CIA, 2013a, b). To ensure that there is a good economic growth in a country, the real GDP in a developing country like India should equally grow on the rate in which its population growth rate is increasing17 (Boyes and Melvin, 2013, p. 361). It means that a developing country should be able to fully utilize its available human resources in order to achieve a full economic growth. Based on these figures presented in the three year real GDP per capita of Russia and India, it is obvious that are quite a lot of people in India who are not given the opportunity to participate in this country’s economic growth. This somehow explains why India has a higher unemployment rate as comapred to Russia18, 19, 20 (CIA, 2013b; Statista, 2013a, b). (See Appendix V – Total Population in Russia between 2003 to 2013 (in millions) on page 19; Appendix VI – Total Population in India between 2003 to 2013 (in millions) on page 20) GDP – Per Capita 2012 2011 2010 Russia $17,700 $17,000 $16.300 India $3,900 $3,700 $3,500 Source: CIA, 2013a, b Inflation Rate Aside from the issue with regards to Russia and India’s real GDP per capita, inflation rate is one of the common economic indicator that can directly affect the economic growth. Basically, inflation rate is defined as “the percentage change in some measure of the price level from one period to the next”21 (Mankiw, 2009, p. 518). It means that inflation is referring to the incidence wherein a country’s price level is increasing. According to the Russian Deputy Economy Minister Andrei Klepach, “inflation is mainly driven by factors beyond the control of the central bank and monetary policy”22 (Korsunskaya, 2012). The European Central Bank (ECB) strongly suggest that a country should be able to meet “inflation rate of less than 2 percent each year” in order to benefit from having a price stability23 (Boyes and Melvin, 2013, p. 291). In Russia, the country’s inflation rate has significantly decreased from 6.85% in 2010 as compared to 5.10% in 2012. Likewise, inflation rate in India has gone down from 11.99% in 2010 as compared to 10.25% in 2012. Even though inflation rate in India has significantly decreased by 1.74% [11.99% - 10.25%], having a 10.25% inflation rate is still very high as compared to ECB’s suggested less than 2 percent inflation rate. The presence of a little inflation rate between 2% to 3% can be good for economic growth because it can trigger the need to increase the wages of people without a sudden and significant increase in the market price of basic goods and services24 (Vanita, 2010, p. 348). However, upon reflecting on the main purpose of these macroeconomic indicators, it makes sense that one of the main problem with having a very high inflation rate is that it would mean that the market prices of basic commodities which are needed in the production of goods also increses. Within a given market, the government can make use of fiscal policy to implement a price ceiling on basic commodities. Without increasing the market prices of the finished goods and services, some companies may not be able to sustain the monthly fixed cost of running the business. To avoid bankruptcy, most of these affected companies will have no other option but to implement a massive lay-offs. Thus, decreasing the quality of life of most people. Therefore, this theory clearly explains why it is common for countries with high inflation rate to experience a high levels of unemployment rate. Inflation Rate 2012 2011 2010 Russia 5.10% 8.44% 6.85% India 10.25% 8.86% 11.99% Source: Statista, 2013c, d Exchange Rate Trade balance is all about the real value of exported goods and services minus the value of imported goods and services25 (Brux, 2011, p. 273). In almost all cases, fluctuations in the exchange rate is one of the economic factors that can highly affect international trading such as people’s decision to import and export products and services26 (Balassa and Noland, 1988, p. 141). As a result, the presence of a continuous fluctuations in the exchange rate can also affect the economic performance of a country. Russian Rubles (RUB) is the currency used by Russia27 (Foreign Exchange, 2013a) whereas Indian Rupee (INR) is the currency used by India28 (Foreign Exchange, 2013b). For example, given that the RUB is weak, most of the business people in this country would prefer and be more encouraged to export their products and services to other nearby country. Assuming that the increase in exportation is more than the importation of goods and services, then Russia will have a trade surplus. Given that the RUB is strong and business people in this country continue to focus on exportation of goods and services, then definitely, Russia’s economy will have a trade surplus. On the contrary, in case the RUB is weak and business people in Russia will continue import products and services more than exporting their own products and services, then Russian economy is at risk of having a trade deficit. Basically, the same concept applies to the case of India. (See Appendix VII – Historical Fluctuations in Russian Rubles (RUB) and Indian Rupee on page 21) Aside from affecting the business people’s decision to import and export products and services, fluctuations in the exchange rate could also affect the movements in the market prices of basic commodities. For example, the Oil and Natural Gas Corporation (ONGC), which is the largest oil company in India, is purely state-owned29 (U.S. Energy Information Administration, 2011). India’s consumption of oil has always been greater than its production of oil30 (U.S. Energy Information Administration, 2011). Therefore, assuming that the INR is weak and then the global market price of oil increases, the Indian government together with the rest of the business people in this area will have no other choice but to import oil. Instead of losing some money, most of the private-owned local oil companies in India will have to pass on the price increase to the public consumers; not unless the importation of oil is a state-owned company. As a result, other industry and manufacturing sectors will also have to pass on the charges to the public consumers. Within this context, fluctuations in the exchange rate can somehow indirectly lead to the development of a higher inflation rate. (See Appendix VIII – India’s Oil Production and Consumption, 2000 – 2010 on page 22) Balance of Payment Under the study of macroeconomics, the balance of payment is defined as the “statistical statement that systematically summarizes, for a specific period of time, the economic transactions of an economy with the rest of the world”31 (International Monetary Fund, 2005, p. 1). In other words, the balance of payment monitors all money that goes in and out of a country32 (Vanita, 2010, p. 349). To obtain an accurate record of money inflows and outflows, the balance of payments compute for the differences between the “aggregate domestic output and aggregate domestic expenditure (with a surplus if output is larger or vice versa)”33 (Gowland, 1983, p. 88). Based on the report made by the World Bank and the Organisation for Economic Co-operation and Development (OECD), the balance of payment in Russia has significant increased from 71,079,883,580 in 2010 as compared to 98,834, 392,520 in 201134, 35 (OECD, 2013; The World Bank, 2013). Back in 2008, Russia’s balance of payment was as high as 103,529,764,70036 (The World Bank, 2013). Even though these figures are significantly much lower as compared to Russia’s balance of payment back in 2008, Russia was able to maintain a surplus in its balance of payment. There are quite a lot of factors which could have made Russia’s balance of payment increase over time. For example, the significant increase in Russia’s balance of payment could mean that Russia has a strong exportation as compared to importation. In response to globalization, a positive and constantly increasing balance of payment could also mean that there are quite a lot of people in Russia who are currently working in other countries. Furthermore, this figure could mean that the inflow of remittances from Russians who are either working abroad or doing business in a foreign country is constantly increasing over time. The case of India is totally different from Russia. Since 2008 up to 2010, India’s balance of payment has been negative. In line with this, the World Bank reported that India’s balance of payment back in 2008 was -30,971,18137 (The World Bank, 2013). Deficit in India’s balance of payment even increases from -30,971,181 in 2008 up to -51,780,997,115 in 201038 (The World Bank, 2013). Since the era of globalization, some people would think that most of the job opportunities has already been transferred from developed countries down to developing countries. However, India’s balance of payment shows that India’s economy has gotten worst over the past few years. Similar to the case of Russia, there are also quite a lot of factors which could have made India’s balance of payment fall into a deficit. For example, upon analyzing the case of India, such deficit in India’s balance of payment could mean that the outflow of money is so much greater than the inflow of money. It means that India’s exportation of goods is way below the levels of their total yearly importation values. Because of culture and a more conservative outlook in life, it could mean that most of the jobless people in India prefer to stay in their motherland rather than trying to work in a foreign country. (See Appendix IX – Comparison between Russia’s and India’s Balance of Payment between 2010 to 2012 on page 23) Balance of Payment (BOP) 2011 2010 2009 2008 Russia 98,834, 392,520 71,079,883,580 48,604,688,889 103,529,764,700 India - -51,780,997,115 -25,921,764,322 -30,971,987,181 Source: The World Bank, 2013 Discussion To verify the truth behind the hypotheses mentioned earlier, let us take a closer look on the news and explanations presented by Reuters. Despite having abundant oil and natural resources, Andy Smith – head of equity reearch at Sberbank CIB clearly explained that “Russia’s economy and GDP are diven primarily by consumption” because Russia’s GDP is composed of 2/3 consumer-oriented sectors39 (Bush, 2013). Earlier, it was mentioned that the unemployment rate in Russia has gone done from 7.5% in 2010 down to 6.0% in 201240 (Statista, 2013a) whereas its inflation rate has gone down from 6.85% in 2010 down to 5.10% in 201241 (Statista, 2013c). Due to global economic recession back in 2007 to 2007, Russia experienced a slow growth in investment42 (Dyakina, 2011). Even though Russia was experiencing a slow growth in investment, the fact that the Russian government managed to create more jobs for the local people and keep down the country’s inflation rate was the secret behind Russia’s success in terms of its economic growth43 (Dyakina, 2011). Since almost 55% of the entire Russian population are already earning between $6,000 to $15,000 per month44 (Bush, 2013), a lot of them are capable of buying their preferred consumer products. This somehow explains why there was a significant increase in Russia’s GDP per capita from $16,300 in 2010 up to $17,700 in 201245 (CIA, 2013a). Because of the people’s ability to purchase consumer goods at a much reasonable market prices, Russia’s economy has experienced an 80% growth rate since 200446 (Bush, 2013). In fact, President Vladimir Putin has recently reported that Russia’s economy is expected to maintain its 4% economic growth rate over the next 3 years47 (Kelly and Golubkova, 2012). Recently, Singh (2012) reported that India’s economic growth is more likely to go down up to “three-year low”48. It only means that India’s economy is facing a serious economic difficulty up to the present time. Considering the current economic situation in India, this country will have not have “a sharp or an impressive recovery”49 (Singh, 2012). The GDP of India is expected to increase at a yearly estimate value of 5.0%50 (Reuters, 2013). However, due to high inflation rate, there is a slow economic growth in India’s trading business and hotel industry including the construction, transportation and communications sectors over the past few months51 (Reuters, 2013). In response to a high fiscal deficit, another reason behind the slow economic growth in India is because of the government’s decision to cut down their spending52 (Himatsingka, 2013). Despite having a 5.5% GDP growth rate, India is reported to face their worst economic performance during the last decade53, 54 (Reuters, 2013; Singh, 2012). To improve India’s economic growth, Sircar (2013) strongly suggest that this country should shift its focus on the exportation of its agricultural products55. Conclusion The research findings presented in this report is similar to the news articles that were published by Reuters in the sense that Russia is currently benefiting from a good economic growth whereas India is experiencing a worst economic growth. In most cases, looking at the nominal GDP values alone can be very misleading in the sense that having a positive and contantly increasing nominal GDP values does not necessarily mean that a country is experiencing a successful economic growth rate. Instead, one should consider taking a look at the country’s real GDP values because this particular economic indicators considers the impact of high inflation rate. To ensure that the use of these economic indicators are accurate, one should look at the changes in the unemployment rate, the per capita real GDP, total population, inflation rate, and balance of payment. In most cases, a negative balance of payment strongly suggest that there is a serious economic problem going on in a particular country. Since most of the countries with negative balance of payment are more focused on the importation of products and services rather than exportation of goods and services, the money that goes out of the country does not return back to the economy. As a result of the continuous money outflows, countries like India does not have enough money on hand which can be used in creating more jobs for the local people. Therefore, it is common for countries with negative balance of payment to have a high unemployment rate, a high inflation rate, and a very low per capita real GDP values. Even though fluctuations in the exchange rate does not directly tells us whether or not a country is experiencing economic growth, values taken from this particular economic indicator can somehow help us analyze factors that can cause significant changes in the market price of basic commodities and a sudden change in the inflation rate. Therefore, when examining the growth rate of a country, it is best to avoid looking at only one economic indicator. Bibliography Balassa, B. and Noland, M. (1988). Japan in the World Economy. Washington, DC: Institute for International Economics. Boyes, W. and Melvin, M. (2013). Economics. Mason, OH: South-Western Cengage Learning. Boyes, W. and Melvin, M. (2013). Economics. 9th Edition. Mason, OH: South-Western Cengage Learning. Brux, J. (2011). Economic Issues & Policy. 5th Edition. Mason, OH: South-Western Cengage Learning. Bush, J. (2013, February 5). Reuters. Consumers to power Russian economy, stock market-study. [Online] Available at: http://www.reuters.com/article/2013/02/05/russia-consumers-idUSL5N0B587R20130205 [Accessed 17 March 2013]. CIA. (2013a). Russia. [Online] Available at: https://www.cia.gov/library/publications/the-world-factbook/geos/rs.html [Accessed 17 March 2013]. CIA. (2013b). India. [Online] Available at: https://www.cia.gov/library/publications/the-world-factbook/geos/in.html [Accessed 17 March 2013]. Dwivedi, D. (2010). Macroeconomics 3e. Delhi: Tata McGraw Hill. Dyakina, M. (2011, October 25). Reuters. UPDATE 1-Russian economic growth gains speed in Q3. [Online] Available at: http://www.reuters.com/article/2011/10/25/russia-economy-idUSL5E7LP46T20111025 [Accessed 17 March 2013]. Foreign Exchange. (2013a). Russian Ruble (RUB) To US Dollar (USD) History. [Online] Available at: http://rub.fx-exchange.com/usd/exchange-rates-history.html [Accessed 17 March 2013]. Foreign Exchange. (2013b). US Dollar (USD) To Indian Rupee (INR) Currency Exchange History. [Online] Available at: http://usd.fx-exchange.com/inr/exchange-rates-history.html [Accessed 17 March 2013]. Gowland, D. (1983). International Economics. Fyshwick: Croom Helm Ltd. Hall, R and Lieberman, M. (2010). Macroeconomics: Principles & Applications. Mason, OH: South-Western Cengage Learning. Himatsingka, Y. (2013, February 26). Reuters. India GDP growth expected to have slowed further in Dec quarter. (Reuters) - India's annual economic growth is expected to have slowed to 5.0 percent in the three months to December due partly to a struggling farm sector, having already struck a near three-year low of 5.3 percent in the previous quarter, according to a Reuters poll: http://www.reuters.com/article/2013/02/26/us-india-economy-gdp-idUSBRE91P05U20130226 [Accessed 17 March 2013]. International Monetary Fund. (2005). Balance of Payments Textbook, Volume 31. Washington, DC: International Monetary Fund. Kelly, L. and Golubkova, K. (2012, October 2). Reuters. Russian economy to keep up 4 pct growth pace: Putin. (Reuters) - Russia's economy should sustain its current 4 percent growth rate over the next three years, President Vladimir Putin said on Tuesday, playing up its relatively strong performance as the global economy slows: http://uk.reuters.com/article/2012/10/02/uk-russia-economy-putin-idUKBRE8910HM20121002 [Accessed 17 March 2013]. Kennedy, P. (2000). Macroeconomic Essentials, 2nd Edition: Understanding Economics in the News. US: Massachusetts Institute of Technology. Korsunskaya, D. (2012, October 19). Reuters. UPDATE 1-Russia economy weakened by monetary tightening-econ ministry. [Online] Available at: http://www.reuters.com/article/2012/10/19/russia-gdp-idUSL5E8LJRM320121019 [Accessed 17 March 2013]. Mankiw, N. (2009). Principles of Economics, Volume 1. Mason, OH: South-Western Cengage Learning. OECD. (2013). Balance of Payments (MEI). [Online] Available at: http://stats.oecd.org/Index.aspx?QueryId=3017# [Accessed 17 March 2013]. Reuters. (2013, February 7). Expert Views: FY13 GDP estimate worst of all growth projections. (Reuters) - India's g[Accessed 17 March 2013].ross domestic product (GDP) is estimated to grow an annual 5.0 percent in the 2012/13 fiscal year, a government statement said on Thursday, citing provisional estimates. [Online] Available at: http://in.reuters.com/article/2013/02/07/india-gdp-ify13-forecast-idINDEE91604920130207 [Accessed 17 March 2013]. Singh, R. (2012, November 30). Reuters. (Reuters) - India's economic growth likely hovered near a three-year low in the last quarter, underscoring the urgency of implementing politically difficult reforms to spur a revival in Asia's third largest economy. [Online] Available at: http://in.reuters.com/article/2012/11/29/india-economy-gdp-idINDEE8AS0FT20121129 [Accessed 17 March 2013]. Sircar, S. (2013, March 13). Reuters. HSBC, Morgan Stanley cut India's FY14 GDP forecasts. Reuters Market Eye - Morgan Stanley and HSBC each cut their India's economic growth forecasts for 2013/14 to 6.0 percent from 6.2 percent to reflect lower-than-expected growth in the October-December quarter: http://in.reuters.com/article/2013/03/13/hsbc-morgan-stanley-cut-indias-fy14-gdp-idINDEE92C02Y20130313 [Accessed 17 March 2013]. Statista. (2013a). Russia: Unemployment rate from 2003 to 2013. [Online] Available at: http://www.statista.com/statistics/17339/unemployment-in-russia/ [Accessed 17 March 2013]. Statista. (2013b). India: Unemployment rate from 2010 to 2012. [Online] Available at: http://www.statista.com/statistics/170854/unemployment-in-india/ [Accessed 17 March 2013]. Statista. (2013c). Russia: Inflation rate from 2003 to 2013 (compared to the previous year). [Online] Available at: http://www.statista.com/statistics/171867/inflation-rate-in-russia/ [Accessed 17 March 2013]. Statista. (2013d). India: Inflation rate from 2003 to 2013 (compared to the previous year). [Online] Available at: http://www.statista.com/statistics/170812/inflation-in-india/ [Accessed 17 March 2013]. Statista. (2013e). Russia: Total population from 2003 to 2013 (in millions). [Online] Available at: http://www.statista.com/statistics/19330/total-population-of-russia/ [Accessed 17 March 2013]. Statista. (2013f). India: Total population from 2003 to 2013 (in millions). [Online] Available at: http://www.statista.com/statistics/19326/total-population-of-india/ [Accessed 17 March 2013]. The World Bank. (2013). Current account balance (BoP, current US$). [Online] Available at: http://data.worldbank.org/indicator/BN.CAB.XOKA.CD [Accessed 17 March 2013]. U.S. Energy Information Administration. (2011, November 21). India boasts a growing economy, and is increasingly a significant consumer of oil and natural gas. [Online] Available at: http://www.eia.gov/countries/cab.cfm?fips=IN [Accessed 17 March 2013]. Vanita, A. (2010). Macroeconomics: Theory and Policy. New Delhi: Dorling Kindersley. Appendix I – Unemployment Rate in Russia between 2003 to 2013 Source: Statista, 2013a Appendix II – Unemployment Rate in India between 2010 to 2012 Source: Statista, 2013b Appendix III – Inflation Rate in Russia between 2003 to 2013 Source: Statista, 2013c Appendix IV – Inflation Rate in India between 2003 to 2013 Source: Statista, 2013d Appendix V – Total Population in Russia between 2003 to 2013 (in millions) Source: Statista, 2013e Appendix VI – Total Population in India between 2003 to 2013 (in millions) Source: Statista, 2013f Appendix VII – Historical Fluctuations in Russian Rubles (RUB) and Indian Rupee (INR) Source: Foreign Exchange, 2013a Source: Foreign Exchange, 2013b Appendix VIII – India’s Oil Production and Consumption, 2000 – 2010 Source: U.S. Energy Information Administration, 2011 Appendix IX – Comparison between Russia’s and India’s Balance of Payment between 2010 to 2012 Source: OECD, 2013 Source: The World Bank, 2013 Total Number of Words: 3,019 Read More
Cite this document
  • APA
  • MLA
  • CHICAGO
(“Economic performance of Russia and India (2010-2012) Essay”, n.d.)
Economic performance of Russia and India (2010-2012) Essay. Retrieved from https://studentshare.org/macro-microeconomics/1470210-economic-performance-of-russia-and-india-2010-2012
(Economic Performance of Russia and India (2010-2012) Essay)
Economic Performance of Russia and India (2010-2012) Essay. https://studentshare.org/macro-microeconomics/1470210-economic-performance-of-russia-and-india-2010-2012.
“Economic Performance of Russia and India (2010-2012) Essay”, n.d. https://studentshare.org/macro-microeconomics/1470210-economic-performance-of-russia-and-india-2010-2012.
  • Cited: 0 times

CHECK THESE SAMPLES OF Economic performance of Russia and India (2010-2012)

The implications of the Euro-Zone Crisis and Its Impact on India Economy

The author of this paper aims to understand india's economy and the long term effects of the global economy in india.... In this essay, we shall be seeking to understand more about the Euro-zone crisis and its impact on india.... india is not part of the Euro-zone but it is a recipient of the crisis as the zone forms its larger market in Europe.... The great recession in russia, the United States housing bubble and the Euro-zone crisis....
12 Pages (3000 words) Coursework

Economic Factors Affecting on the Value Stock Exchange of Thailand Index

The literature review studies seven macroeconomic variables that affect stock value of Stock Exchange of Thailand through application of Arbitrage Pricing… Arbitrage Pricing Theory is an alternative to Capital Asset Pricing Theory; the model has been used throughout time to determine returns of Ross states that the theory predicts the returns on assets and the other risk factors....
14 Pages (3500 words) Literature review

Canadas investment in the BRIC nations

nbsp;WeaknessesPereira(1) notes that the rate of growth in Brazil was only 3% in 2013, which is quite low, compared to that of China and india which was approximately 8% and 6% respectively.... In the paper “Canada's investment in the BRIC nations” the author analyzes BRIC as an acronym for the combined economies of Brazil, Russia, india and China.... He states that in the next fifty years, the four countries would be wealthier than most of the current dominating economic powers....
12 Pages (3000 words) Essay

Monster Energy Drink in Russia

Brazil, india, China, South Africa, and Russia are increasingly attractive to companies seeking to expand their revenue streams and gain competitive advantages over their competitors.... This paper will evaluate the attractiveness of the Russian market to Monster Energy, an energy drink company based in the US....
9 Pages (2250 words) Essay

Advertising and Globalization in India

This paper focuses on the concept of development of TV and satellite advertising in india as promoted by globalization and an explanation of the key theories from research and literature to justify the claims by Ciochetto in the study.... Advertising campaigns that work best in a country in Asia such as india may not necessarily have a similar impact to that in the west such as the U.... This concept forms the basis of a study conducted by Ciochetto in india....
7 Pages (1750 words) Essay

The Economic Performance of BRIC Countries

?? Explain Your Answer With Reference to the economic performance of so Called BRIC Countries. “Many people see globalisation as an opportunity for international… ness, but it is clearly a threat.... ?? This study argues against the statement of using the hypothetical cases of the economic performance of BRIC countries.... Globalisation is associated with economic growth, international business and financial market.... Globalisation can be examined from different perspectives such as economic, political and social perspectives....
12 Pages (3000 words) Essay

Analysis of the Cultural Differences between Russia and India

billion people, india is the second most populated country in the world.... india exhibits a conservative culture characterized by male domination in the social structure.... nbsp; Viewing the newly acquired Tel-Com as part of the system will influence the development of management structures that will sustain dedicated market researches thereby determining new markets within the large india population thereby ensuring that the company does not incur losses....
8 Pages (2000 words) Term Paper

Car Insurance in Russia in Comparison with EU

The rapid growth of what is termed as BRIC (Brazil, Russia, india, and China) countries (Pineiro-Chousa et al, 2008) has seen a dramatic increase in automotive ownership (EconomyWatch, 2010b).... The paper will investigate the field of automotive insurance in russia as compared against the EU.... This aspect of the research is a highly important foundational underpinning as prior to russia's accession to the World Trade Organisation in 2012 (WTO, 2012) its insurance sector was controlled by the state (Deloitte, 2009)....
8 Pages (2000 words) Research Proposal
sponsored ads
We use cookies to create the best experience for you. Keep on browsing if you are OK with that, or find out how to manage cookies.
Contact Us