StudentShare
Contact Us
Sign In / Sign Up for FREE
Search
Go to advanced search...
Free

Selecting a Macroeconomic Variable - Essay Example

Cite this document
Summary
This essay "Selecting a Macroeconomic Variable" discusses inflation as a macroeconomic variable for Canada. In the course of doing this, three major explanatory variables were identified as exchange rate, wage increase, and money supply growth…
Download full paper File format: .doc, available for editing
GRAB THE BEST PAPER95.6% of users find it useful
Selecting a Macroeconomic Variable
Read Text Preview

Extract of sample "Selecting a Macroeconomic Variable"

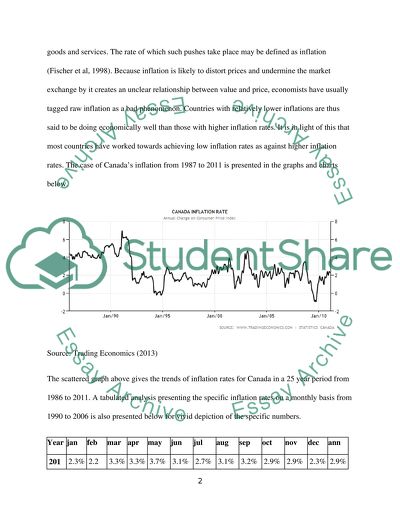
?SELECTING A MACROECONOMIC VARIABLE Introduction Indeed, macroeconomics is an aspect of economic studies that makes it possible to undertake a study of the economy of a country as a collective unit (Barbakadze, 2008). This means that macroeconomics is the study of the economy as a whole. This depicts the huge nature of macroeconomics that makes it relatively difficult to study as a single subject. To this end, macroeconomics is studied using various variables of the collective economy. In the present study, the inflation rate of Canada is studied as one of the core macroeconomic variable of the country that helps in determining the macroeconomic status of Canada. The inflation rates of the country shall be studied over a period of 25 years ending in 2011 inclusive. The selection of the inflation rate of Canada comes in at a very ripe time and with so much significance and importance as global economic experts continue to blame inflation as a major dictate of the world economic climate (Botric and Cota, 2006.). It is therefore anticipated that this study would eventually end up as a guide for economic policy makers within the country to ascertain various ways in which inflation has affected Canada’s economy in times past and how it affects it today so that based on these, they can make prudent economic decisions for Canada in the future, using inflation rates. Dependent variable Inflation is a determining component for the relationship that exists between value and price (Grigorian et al, 2008). Generally, an economy that is growing so fast would see a situation whereby prices of goods are pushed to a protracted time ahead of the prevailing utility value of goods and services. The rate of which such pushes take place may be defined as inflation (Fischer et al, 1998). Because inflation is likely to distort prices and undermine the market exchange by it creates an unclear relationship between value and price, economists have usually tagged raw inflation as a bad phenomenon. Countries with relatively lower inflations are thus said to be doing economically well than those with higher inflation rates. It is in light of this that most countries have worked towards achieving low inflation rates as against higher inflation rates. The case of Canada’s inflation from 1987 to 2011 is presented in the graphs and charts below. Source: Trading Economics (2013) The scattered graph above gives the trends of inflation rates for Canada in a 25 year period from 1986 to 2011. A tabulated analysis presenting the specific inflation rates on a monthly basis from 1990 to 2006 is also presented below for vivid depiction of the specific numbers. Year jan feb mar apr may jun jul aug sep oct nov dec ann 2011 2.3% 2.2% 3.3% 3.3% 3.7% 3.1% 2.7% 3.1% 3.2% 2.9% 2.9% 2.3% 2.9% 2010 1.9% 1.6% 1.4% 1.8% 1.4% 1% 1.8% 1.7% 1.9% 2.4% 2% 2.4% 1.8% 2009 1.1% 1.4% 1.2% 0.4% 0.1% -0.3% -0.9% -0.8% -0.9% 0.1% 1% 1.3% 0.3% 2008 2.2% 1.8% 1.4% 1.7% 2.2% 3.1% 3.4% 3.5% 3.4% 2.6% 2% 1.2% 2.4% 2007 1.1% 2% 2.3% 2.2% 2.2% 2.2% 2.2% 1.7% 2.5% 2.4% 2.5% 2.4% 2.1% 2006 2.8% 2.2% 2.2% 2.4% 2.8% 2.4% 2.3% 2.1% 0.7% 1% 1.4% 1.7% 2% 2005 1.9% 2.1% 2.3% 2.4% 1.6% 1.7% 2% 2.6% 3.2% 2.6% 2% 2.1% 2.2% 2004 1.3% 0.7% 0.8% 1.7% 2.4% 2.5% 2.3% 1.8% 1.8% 2.3% 2.4% 2.1% 1.9% 2003 4.5% 4.7% 4.2% 2.9% 2.8% 2.6% 2.1% 2% 2.2% 1.6% 1.6% 2.1% 2.8% 2002 1.3% 1.4% 1.9% 1.7% 1.1% 1.2% 2.1% 2.5% 2.3% 3.2% 4.4% 3.8% 2.3% 2001 3% 2.9% 2.4% 3.5% 3.9% 3.4% 2.7% 2.8% 2.6% 1.9% 0.6% 0.7% 2.5% 2000 2.2% 2.7% 3% 2.2% 2.4% 2.8% 2.9% 2.6% 2.7% 2.8% 3.2% 3.2% 2.7% 1999 0.7% 0.7% 1% 1.6% 1.5% 1.6% 1.9% 2.1% 2.6% 2.3% 2.2% 2.6% 1.7% 1998 1.1% 1% 1% 0.9% 1.1% 1% 1% 0.9% 0.7% 1.1% 1.2% 1% 1% 1997 2.2% 2.3% 1.9% 1.7% 1.5% 1.7% 1.7% 1.8% 1.7% 1.5% 0.9% 0.8% 1.6% 1996 1.6% 1.3% 1.5% 1.4% 1.5% 1.5% 1.3% 1.5% 1.5% 1.8% 1.9% 2.2% 1.6% 1995 0.6% 1.9% 2.1% 2.5% 2.9% 2.7% 2.6% 2.2% 2.2% 2.3% 2.1% 1.7% 2.1% 1994 1.3% 0.1% 0.2% 0.2% -0.2% 0% 0.1% 0.1% 0.2% -0.2% -0.1% 0.2% 0.2% 1993 2% 2.4% 1.9% 1.8% 1.9% 1.7% 1.7% 1.8% 1.8% 1.9% 1.9% 1.7% 1.9% 1992 1.6% 1.6% 1.6% 1.7% 1.3% 1.1% 1.2% 1.1% 1.3% 1.6% 1.7% 2.2% 1.5% 1991 6.9% 6.2% 6.2% 6.2% 6.2% 6.3% 6% 6% 5.5% 4.4% 4.1% 3.8% 5.6% 1990 5.5% 5.5% 5.3% 5% 4.4% 4.4% 4.1% 4.1% 4.2% 4.7% 5.1% 5% 4.8% Source: Rate Inflation (2013) A critical study of the empirical data presented above shows that the annual average of Canada’s inflation is 3.2 percent. The same value is also quoted by the Statistics Canada, which is the body responsible for determining inflation rate in Canada (Coorey et, 1996). A study of the inflation rates would however show a system whereby some of the highest rates of inflation was attained in the 1990s as against the 2000s. This trend could be as a result of globalised economic performance on Canada as a singular nation as against the individual role played by Canada. This is because the past decade starting in the 2000s saw a rapid advancement in globalization whereby nations began trading on free border basis sharply (Hernandez-Cata, 1999). A distinctive episode in the inflation rates occurs in the latter part of 2010 and 2011 as a whole, where the inflation rates were higher than years of 2007 and 2008 when the whole world was said to be in recession and inflation of most countries started dwindling. This could also be an indication of the inability of policy makers to sustain the rapid rate of economic growth that accompanied the end of the recession, which saw most of 2009 inflation rates going as low as negative values. Theoretical analysis Even though inflation has been selected as the determinant macroeconomic variable for discussion, it is important to note that inflation in itself is also determined by a number of factors and sub variables. These are commonly referred to as explanatory variables. There are about three of these explanatory variables that can be discussed in the case of inflation in Canada. Agayev (2011) identifies three of such explanatory variables of inflation as exchange rate growth, wage increases and money supply growth. The main role of these explanatory variables is that they help in determining what the inflation of Canada would be for a given period of time. Thereafter, the three explanatory variables are critically analyzed from a theoretical basis. Exchange Rate Growth Exchange rate growth is regarded as a cost-push factor that affects the trend and flow of inlfation. This is because exchange enters the domestic price index through the use of imported inputs and imported consumer goods (Rutasitara, 2004). The ultimate effect that this phenomenon has on the prevailing economy is that because imported goods are eventually sold, when exchange rates go up and importers pay more, the only way importers avoid recording losses is by increasing the prices of their goods. There therefore exists a unilateral relationship between exchange rate growth and inflation whereby increases in the growth of exchange rate would automatically signal an identical growth in inflation. Monetary policy makers who want to avoid rising inflation therefore have to deal with exchange rate growth. In the case of Canada, it is on record that Canada remains one of the least importing countries in the Americas. To this end, the country is not pressurized to increase prices of consumer goods as a result of increases in exchange rate growth. It is for this reason that there has been a relatively lowered average inflation rate of 3.4% for the past 25 years (Cottarelli et al, 1998). Wage Increase The wage bill of Canada is also very significant in the determination of inflation for that country. In Canada and other developed economies, increase in the general cost of goods and services is said to be preceded often by increases in wages (Fischer et al, 1996). This is because once there are increases in wages, the demand for goods and services go up and by the principle and theory of demand and supply, prices go up. Meanwhile, increases in the prices of goods and services remain a direct and resultant effect on the rate of inflation (Holtz-Eakin et al, 2008). The relationship that exists between wage increase and inflation is what has been explained by many as wage push inflation. The Trading Economics Online Journal (2013) posits that in Canada, the consumer price index basket sees its alterations resulting from consumables such as shelter, transportation, food, household operations, recreation, education, health, alcoholic beverages among others. Meanwhile, socio-economists have said that most of the standards by which the populace within the country purchases these consumables are directly related to the amount of wages they earn (Hernandez-Cata, 1999). What this means is that once wages increase, the demand for these goods and services would go up and thus prices would also go up. The chart below represents the rate at which the various goods and services influence the categorization of the consumer price index basket. Money supply Growth In totality, the sum of monetary assets present in an economy presents the money supply, otherwise known as the money stock of the economy (Holtz-Eakin et al, 2008). This money supply places so many roles in the determination of the inflation of any given economy. It is in this regard that the Bank of Canada (2012) indicates that it monitors several different indicators to ensure that it achieves its inflation target, of which monetary aggregate is one of the factors. It is worth noting that monetary aggregates refer to the means by which the amount of money in circulation may be measured. Through these monetary aggregates, the Bank of Canada is able to get a fairer idea of the quantum of money in circulation in the economy. In cases where the bank finds in its prudent economic measure that the quantum of money is too much and would affect inflation negatively by causing it to rise, the bank would simply introduce measures like the increase in interest rates to ensure that borrowing is reduced and thus the among of money supply (Grigorian et al, 2008). Interpretation and explanation As far as the explanatory variables and the dependent variable are concerned, there are two major relationships that can be drawn between each of the explanatory variables and the dependant variable. These relationships are either positive or negative. In either case also, the relationship could be explained as either being significant or insignificant. A positive relationship is a situation whereby increase in any of these explanatory or independent variables over the last 25 years has caused increase in inflation and vice versa. In order to get a clearer picture of the relationship that exists between Canada’s money supply growth and inflation, the money supply rate for the four final years are compared with the inflation rates for the four final years of the 25 period being looked at. This comparison is done using the table below Money supply /Average Inflation 2008 2009 2010 2011 Rate Trend Rate Trend Rate Trend Gross M1 444,854 504,158 Increase 614,180 Increase 667,823 Increase M2 832,340 945,359 Increase 1,003,898 Increase 1,055,534 Increase M3 1,255,248 1,297,218 Increase 1,363,182 Increase 1,464,626 Increase Average Inflation 2.4 0.3 decrease 1.8 Increase 2.9 Increase From the table above, it can be noticed that as far as money supply and inflation are concerned, for majority times that there are increases in the money supply rate, there are corresponding increases in the inflation rate. The only period when there were negative relationships was in 2009 when money supply increased but inflation decreased. But even with this year, it could be noticed that the rate of increase in money supply was not as high as it had been in other years. In terms of wage increase, an empirical secondary research data conducted by Statistics Canada and presented by CBC News (2013) has it that “Canada's inflation rate held steady at 2.9 per cent in November, which means the cost of living is going up slightly faster than people's paycheques.” The implications of this secondary research findings is that as far as Canada is concerned, there is a negative relationship between inflation and wage rates whereby inflations increases faster than the wage growth rate of workers. What this may be attributable to is that workers within the labor force continue to demand more for goods and services even above the rates of wage. The table below also gives the interpretation and relationship between inflation and exchange rate. Exchange Rate /Average Inflation 2008 2009 2010 2011 Rate Trend Rate Trend Rate Trend Exchange Rate 0.937 0.876 decrease 0.971 Increase 1.011 Increase Average Inflation 2.4 0.3 decrease 1.8 Increase 2.9 Increase From the table, a qualitative representation of the relationship between inflation and exchange rate for the four last years of the 25 years under review is undertaken. From this qualitative description, it can be observed that whenever there is increase in exchange rate, there is a corresponding increase in inflation and whenever there is a decrease in exchange rate, there is a corresponding decrease in inflation. This means that the relationship between exchange rate as a determinant variable and inflation as a dependent variable is positive. Conclusions The paper has been dedicated to critically studying inflation as a macroeconomic variable for Canada. In the course of doing this, three major explanatory variables were identified as exchange rate, wage increase and money supply growth. It can be concluded thus far that of the three explanatory variables, exchange rate is the single most directly determining variable for Canada’s inflation rate. This is because for the past four years under review, whenever there is an increase in exchange rate, there is a corresponding increase in the inflation rate of Canada. When there are decreases also, there are direct decreases in the inflation of Canada. The explanatory variable that follows next is money supply as foe greater parts of the period under review, an increase in money supply rate corresponded with increase in inflation rate and decrease in money supply rate corresponded with decrease in inflation rates. For wage increase however, it can be said that it is not an absolute determinant of inflation for Canada. This is because the consumer behavior of the people is such that they continue to demand for more goods and services even when there are low wages (Holtz-Eakin et al, 2008). For this reason, stable wage rate still brings about increases in inflation rates. References Agayev, Samuel. Exchange Rate, Wages, and Money; What Explains Inflation in CIS Countries: Panel Causality and Panel Fixed Effects Analysis. 2011. Web. Februart 13, 2013 Bank of Canada Canada’s Money Supply. 2012. Web. February 12, 2013 Barbakadze, Ivane, 2008. “Explaining Inflation in Georgia: Do Exchange Rate and Nominal Wage Matter?”, The National Bank Georgia Working Paper WP4. Botric, V. and B. Cota, 2006. “Sources of Inflation in Transition Economy: The Case of Croatia”, Ekonomski Pregled, 57(12), 835-855. CBC News. Canadian salary increases lag inflation rate. 2013. Web. February 13, 2013 Coorey, S., M. Mecagni, and E. Offerdal, 1996. “Disinflation in Transition Economies: The Role of Relative Price Adjustment”, IMF Working Paper WP/96/138. Cottarelli, C., M. Griffiths, and R. Moghadam, 1998. “The Nonmonetary Determinants of Inflation: A Panel Data Study”, IMF Working Papers WP/98/23. Fischer, S., R. Sahay, and C. A. Vegh, 1996. “Stabilization and Growth in Transition Economies: The Early Experience”, IMF Working Paper WP/96/31. Fischer, S., R. Sahay, and C. A. Vegh, 1998. “From Transition to Market: Evidence and Growth Prospects”, IMF Working Paper WP/98/52. Grigorian, D., A. Khachatryan, and G. Sargsyan, 2004. “Exchange Rate, Money, And Wages: What Is Driving Prices In Armenia?” IMF Working Paper WP/04/229. Hernandez-Cata, Ernesto, 1999. “Price Liberalization, Money Growth, and Inflation during the Transition to a Market Economy”, IMF Working Paper WP/99/76. Holtz-Eakin, D, W. Newey, and H. S. Rosen, 1988, “Estimating Vector Autoregressions with Panel Data”, Econometrica, 56/6, 1371–1395. Rate Inflation 2013. Historical Inflation Rates for Canada (1990 to 2011). http://www.rateinflation.com/inflation-rate/canada-historical-inflation-rate?start-year=1990&end-year=2011 Rutasitara, Larry. Current Macroeconomic Trends in Africa. 2004. Web. February 12, 2013 Trading Economics Canada Inflation Rate. 2013. February 12, 2013 Read More
Tags
Cite this document
  • APA
  • MLA
  • CHICAGO
(“Selecting a macroeconomic variable for a country and explaining its Essay”, n.d.)
Selecting a macroeconomic variable for a country and explaining its Essay. Retrieved from https://studentshare.org/macro-microeconomics/1468052-selecting-a-macroeconomic-variable-for-a-country
(Selecting a Macroeconomic Variable for a Country and Explaining Its Essay)
Selecting a Macroeconomic Variable for a Country and Explaining Its Essay. https://studentshare.org/macro-microeconomics/1468052-selecting-a-macroeconomic-variable-for-a-country.
“Selecting a Macroeconomic Variable for a Country and Explaining Its Essay”, n.d. https://studentshare.org/macro-microeconomics/1468052-selecting-a-macroeconomic-variable-for-a-country.
  • Cited: 0 times

CHECK THESE SAMPLES OF Selecting a Macroeconomic Variable

Financial Time series including ARCH-Garch models

Empirical research is often conducted in macroeconomics to estimate variable relationships and test hypothesis of the theories of macroeconomics.... China stock market is a good example of a market that has successfully used the autoregressive conditional heteroscedasticity model to describe the market2 Arch Methodology This financial time series model is used to forecast random variables from information of past variable trends and linearity through specific universal assumptions on the conditional macroeconomic and financial economic variables....
9 Pages (2250 words) Research Paper

Macroeconomic Developments and Determination of Commodity Prices

The Influence of macroeconomic Developments on Determination of Commodity Prices Abstract Research studies in the past have concentrated on microeconomic components on fluctuations in commodity prices but there is adequate evidence linking macroeconomic variables to fluctuations in commodity prices.... This research work aims to identify the influence of macroeconomic developments of the commodity pricing.... Based on the regression analysis, it has been found that macroeconomic factors like economic growth, market speculations, macroeconomic news, consumer instalment credits, trade deficits, variation in demand side, variation in supply side all HIGHLY influence the commodity pricing....
40 Pages (10000 words) Dissertation

Mathematics as a Discipline Has a Very Important Place

The independent variable here is the calculus course taken by the students.... The dependent variable is performance in micro-2 and macro -2.... In the second stage the grades in Micro-2 or Macro-2 (the dependent variable)is regressed on the actual level of the calculus attained (independent variable).... This will also help in understanding why the student with poor calculus understanding finds it hard to grasp the concepts in micro and macroeconomic theory....
5 Pages (1250 words) Essay

International Paper

DP is the most frequently quoted and the most important macroeconomic measure of a nation's economic activity.... The selection of Inflation as one of the macroeconomic measure of output and prices for the planning of the Big Auto Drive can be justified in many ways.... elationship between macroeconomic variables and Big Auto DriveThe sales data of the different commodities of Big Drive Auto shows a kind of uniform trend....
4 Pages (1000 words) Essay

How do news effect financial market

dentifying the macroeconomic variables associated with financial markets is an important step in analyzing the impact of news on the performance of financial markets (Tetlock, 2007).... Amongst the identified macroeconomic variables in the UK include manufacturing index, oil prices, housing index, UK inflation, unemployment, LIBOR rates, long term interest rates, industrial index, service index, and output expectation.... Understanding the behavior of these macroeconomic variables within a financial market as a result of changes in news is likely to assist in the overall understanding of the overall impact of news on financial markets (Roley & Troll, 2003)....
20 Pages (5000 words) Essay

International Macro Post

The article explores macroeconomic challenges that Egypt as a country has after ESSAY, MACRO & MICRO ECONOMICS INTERNATIONAL MACRO POST Various macro and microeconomic policies are based on the learnt theories.... The article explores macroeconomic challenges that Egypt as a country has after the Egyptian revolution.... One key issue that the article explores according to my understanding is the link between civil war or the revolutions and their impact on macroeconomic policies and objectives such as economic growth of the country....
2 Pages (500 words) Essay

The Calibrated Business Model

Calibrated business model is a concept applied to the selection of constraint values due to macroeconomic confirmation and compares the model's calculations concerning the variances and co-variances of different series with those in the statistics (Romer 217-220).... Calibration imposes HW4b Calibrated Business Model Calibrated business model is a concept applied to the selection of constraint values due to macroeconomic confirmation and compares the model's calculations concerning the variances and co-variances of different series with those in the statistics (Romer 217-220)....
2 Pages (500 words) Essay

Impacts of Money Supply, Inflation and Exchange Rate in Kuwait

The research paper 'Impacts of Money Supply, Inflation and Exchange Rate in Kuwait' examines the fundamental macroeconomic relationship, namely that of the Gross Domestic Product (GDP) with the money supply, inflation and exchange rate in Kuwait.... xploring macroeconomic relations in Kuwait is particularly interesting because these above-mentioned features make it distinct from the standard large economies which form the basis for the macroeconomic theory....
10 Pages (2500 words) Term Paper
sponsored ads
We use cookies to create the best experience for you. Keep on browsing if you are OK with that, or find out how to manage cookies.
Contact Us