StudentShare
Contact Us
Sign In / Sign Up for FREE
Search
Go to advanced search...
Free

Testing as an Essential Aspect of the Research - Term Paper Example

Cite this document
Summary
This paper 'Testing as an Essential Aspect of the Research' discusses that the testing consisted of a number of different methods. The first testing approach was to consider the personal attributes in relation to the Diabetic class attribute. …
Download full paper File format: .doc, available for editing
GRAB THE BEST PAPER95.8% of users find it useful
Testing as an Essential Aspect of the Research
Read Text Preview

Extract of sample "Testing as an Essential Aspect of the Research"

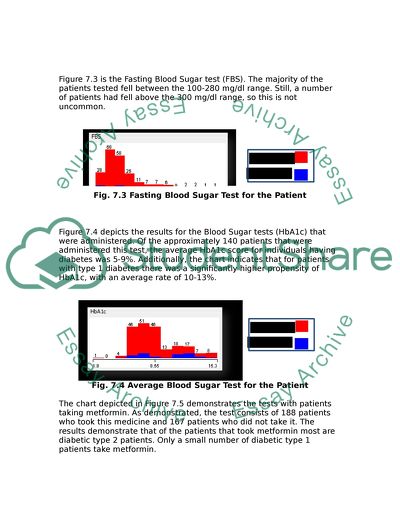
?7. Testing Testing was an essential aspect of the research. The testing consisted of a number of different methods. The first testing approach was to consider the personal attributes in relation to the Diabetic class attribute. Classification techniques were implemented on the collected data as a means of predicting the classifiers. The following is an explication of the Diabetic histogram: Fig. 7.1 contains the diabetic attributes through a division between type 1 (blue) and type 2 (red) diabetes. In total there are 240 males and 119 females. As the research clearly demonstrates, the individuals with type 2 diabetes outnumber those with type 1 across both genders. Additionally, the preponderance of individuals with type 1 diabetes greatly outweighs those with type 2. Fig. 7.1 Gender Figure 7.2 is the histogram that examines patients with both hypertension and diabetes. Of the total sample population the chart indicates that 176 patients had hypertension and a form of diabetes. Conversely, there were 185 patients who had diabetes with no sign of hypertension. Ultimately, close to half of the patients sampled had both diabetes and hypertension. Fig. 7.2 Patients with Hypertension Figure 7.3 is the Fasting Blood Sugar test (FBS). The majority of the patients tested fell between the 100-280 mg/dl range. Still, a number of patients had fell above the 300 mg/dl range, so this is not uncommon. Fig. 7.3 Fasting Blood Sugar Test for the Patient Figure 7.4 depicts the results for the Blood Sugar tests (HbA1c) that were administered. Of the approximately 140 patients that were administered this test, the average HbA1c score for individuals having diabetes was 5-9%. Additionally, the chart indicates that for patients with type 1 diabetes there was a significantly higher propensity of HbA1c, with an average rate of 10-13%. Fig. 7.4 Average Blood Sugar Test for the Patient The chart depicted in Figure 7.5 demonstrates the tests with patients taking metformin. As demonstrated, the test consists of 188 patients who took this medicine and 167 patients who did not take it. The results demonstrate that of the patients that took metformin most are diabetic type 2 patients. Only a small number of diabetic type 1 patients take metformin. Fig. 7.5 Patients Taking Metformin Medication Figure 7.6 considers the patients with diabetes in relation to their age. A notable division occurs here. Namely, patients between 30-70 years old have the highest rate of type 2 diabetes. This shifts with individuals age 5-18, as type 1 diabetes dominates this age bracket. Fig. 7.6 Age of the Patients Figure 7.7 is a diagram depiction of patients with hyperlipidemia. The results indicate that 183 patients have hyperlipidemia, the majority of them also having type 2 diabetes. For type 1 diabetes patients, the majority do not have hyperlipidemia. Fig. 7.7 Patients With Hyperlipidemia Figure 7.8 examines the relation between the patients’ with diabetes and their weight. The chart seems to demonstrate a correlation between the two inputs, as patients between the 70-112 kg range experience the highest levels of type 2 diabetes. Fig. 7.8 Weight of the Patients in Kg Figure 7.9 considers patients with diabetes who also are taking insulin medication. Of the 100 patients taking insulin medication the majority of individuals with type 1 diabetes take it. Conversely, most individuals with type 2 diabetes do not take it. Fig. 7.9 Patients Taking Insulin Medication Figure 7.10 considers patients with an abnormal heart condition because of vascular problems unrelated to diabetes. The diagram demonstrates that most of the patients with diabetes have a normal heart condition, but there is a small number of patients suffering from heart disease. Fig. 7.10 Patient Heart Condition Figure 7.11 examines the patients who took glidazide as medication. 92 patients out of the 257 took glidazide. All of these patients had type 2 diabetes. Fig. 7.11 Patients Taking Glidazide After the above histograms were established and analyzed, a comparative analysis implementing J48 decision trees and association algorithm was implemented. This incorporated the final_medicaldata with WEKA; this is a data mining package. The following are the results of this analysis: 7.1 J-48 The J48 decision tree was considered in Chapter 3. The strategy of this model is a depth-first approach that divides attributes depending on the specific ratio. Additionally, the approach implements a searching method that replaces sub trees with leaves as a means of reducing over filtering. WEKA has the options of choosing pruned or not pruned trees. Fig. 7.12 (J48) Decision Tree Properties in WEKA WEKA also contains a number of test options for data classification: Use Training Set: evaluates the classifier in terms of how well it predicts a specific set of instance inputs. Supplied Test: this evaluates how well the classifier predicts the class of a set of instances from a file. Cross-Validation: The number of fold entered into the WEKA explorer represents the classifier for this set. Percentage Split: This set consider how well the classifier predicts the percentage of data taken out for testing. The percentage field determines how much data will be held out. The value in the data is a part of the data provided in initial training. 66% of the data is trained and 34% is used for testing. Fig. 7.12 Testing Options in WEKA Regarding the supplied data set, the tree performance was measured by Percentage Split and Cross Validation. 7. 2 Decision tree generated using Cross Validation In J48 there are a number of controlling factors. These factors include the confidence factor and the size of the training set the Cross-validation controls. The confidence factor is used to minimize classification error and to specifically address the issue of pruning. As a means of allowing the classifier a more accurate approach, the confidence factor used for the dataset is set at 95%. This leads to 89.2% of correctly classified instances. This is demonstrated in figure 7.14. Fig. 7.14 Result Generated by WEKA Using J-48 Cross-Validation Figure 7.14 contains the decision tree calculations. The Confusion Matrix is included as it demonstrates how frequently the classifier is making errors in predicting a specific class. Dunham (2003) notes that confusion matrixes demonstrate how accurate the solution to a classification problem is; a contingency table is another name for a confusion matrix. Figure 7.15 demonstrates is a confusion matrix. Fig. 7.15 Where: TP = Number of correctly identified positives. FP = Amount of negatives improperly classified as positives. TN = Number of properly classified negatives. FN = Number of positives improperly classified as negatives. Predictive accuracy measures the performance of a classifier. This includes the rate of success calculated using predictive accuracy: Predictive accuracy = 100 * TP + TN / TP + TN + FP +FN Figure 7.14 from earlier demonstrates that decision tree accurately predicted 323 attributes. It was not able to predict 39 attributes. For individuals with type 1 diabetes 26 attributes were predicted correctly and 22 incorrectly. Conversely, for individuals with type 2 diabetes, 297 attributes were predicted accurately and 17 incorrectly. Thus, it is possible to calculate the predictive accuracy for the J48 using cross validation: Predictive Accuracy = 100 * TP + TN / TP + TN + FP + FN = 100 * 26+297/26+297+17+22 =89.2% Figure 7.16 contains the visualization for the J48 decision tree. Fig. 7.16 Decision Tree 7.3 Decision tree generated using Percentage Split The percentage split techniques implement 66% of data for training and 34% for testing. Therefore, 200 instances are used for training and 123 are used for testing. Thus, the J48 decision tree produces a slightly more accurate result than cross validation. Figure 7.17 demonstrates that 111 instances out of 123 are correctly classified, with test result 90.2%. Only 12 instances are incorrectly classified. The confusion matrix in Figure 17.7 demonstrates that for the class (a) “patients with diabetes type 1” 7 attributes are correctly predicted and 5 are incorrectly predicted. Conversely, for patients with type 2 diabetes the decision tree predicts 104 attributes correctly and 7 incorrectly. Therefore the predictive accuracy for J48 can be understood as follows: Predictive Accuracy = 100 * TP + TN / TP + TN + FP + FN =100 * 7 + 104/ 7 +104 + 7 +5 =90.2% Fig. 7.17 WEKA Results Using J-48 Percentage Split Option 7.4 Association Rules Support and confidence are the central elements to consider in relation to association rules, as they represent respectively the usefulness and certainty of discovered rules. Within this spectrum of understanding, there are many types of association rules. This study primarily implements the Apriori rules because it gives a useful relationship between attributes. Nonetheless association rules do not function with numeric data. Rather, the data must be put into ranges. WEKA provides a discretize filter to separate the data into ranges. Figure 7.18 demonstrates the Apriori rule results: Fig. 7.18 WEKA Apriori Association Algorithm Notable rules established by the algorithm: The confidence factor is demonstrated above. WEKA provided the options to set this factor. This is demonstrated in figure 7.19. Fig. 7.19 Apriori Algorithm Options 8. Critical Evaluation While initially applying different data mining techniques to the medical dataset resulted in different results, J48 demonstrated a better performance than the Apriori association rule. The J48 tree was size 51 with 10% classification errors. Most of the errors were attributable to missing values and noise. The tree model built through this process was complex. Still, analyzing this model resulted in a useful emergence of hidden patterns and relationships. For instance, this process revealed that insulin and hyperlipidaemia appeared high in the hierarchy, while age and FBS appeared low. The aforementioned Apriori association rule predicated a number of useful forms. Experimenting with the confidence and association rules helped us maximize the effectiveness of the predicted rules. Apriori supplied the relations between attributes where hidden knowledge further emerged. For instance, the relation of patients with hyperlipidemia to those with diabetes was 98%. These figures reveal a strong relation and possibly point the way for future research. As the insulin and hyperlipidemia attributes were central classification methods, aspects of the study sought to eliminate those attributes. This experiment demonstrated that the elimination of these elements reduced the error classification ratio. Additionally, missing values were another major area of concern. J48 considered that as a separate attribute with high accuracy. The pre-processing approach indicated missing values than 70% of the time. Hamparsum (2004) indicates that missing values can significantly change the effects of classification algorithms and their performance; however, the system has generated valuable patterns and knowledge despite the high number of missing values. 8.1 Lessons Learned There were a number of prominent lessons learned from my experience in this research. Perhaps the most overarching lesson was the nature of time management. While as a student and employee throughout my life I have learned a modicum of time management skills, the extensive array of responsibilities involved in this project pushed me to develop a new approach to time management. Another major area I feel I developed personally in was motivation. While the overriding scope of the project I found highly stimulating I discovered there were certain areas that I would rather avoid. At first I found myself putting these things off, but I eventually came to work at establishing more functional means of motivating myself. In these regards, I came to recognize that the more effort and I put into something the more I came to develop an interest in the topic, thus improving my motivation. Furthermore, gaining a strong feel for conducting my own research outside of the immediate oversight of a lecturer was another significant lesson I came to learn. In these regards, I came to understand that while oftentimes it would seem like I was stuck, I always came to recognize that hard work and research would solve the issues at hand. This resulted in me coming to accept on a deep and meaningful level that there are truly solutions to every problem. 8.2 Ethical and Privacy Issues The main ethical and privacy issue was acquiring the mode data for diabetic patients from the United Arab Emirates hospital. In the beginning I experienced challenges when contacting the medical staff in hospitals, as they were concerned about disclosing patients’ private information. After encountering this challenge I discovered that I had to fill out some ethical forms to get the data. After completing the ethical form the hospitals were willing to release the information contingent on the understanding that the information did not specifically identity any patients. 8.3 Alternative Approaches While there are a number of potential alternative approaches that could have been implemented perhaps the most notable is the ‘hybrid approach’. This approach combines top-down and bottom-up approaches for data mining. This approach can discover precise hidden patterns in the data by extending the knowledge base with several rules. Notably, the bottom-down approach implements a constructivist-like knowledge to the process of discovery. This allows a more comprehensive understanding the data to emerge. The top-down approach then tests these findings. Figure 8.1 demonstrates this method. Fig. 8.1 Hybrid Approach 8.4 Review of the plan In reviewing the plan all the tasks that were originally scheduled were finished. While there were small changes in the timeline, the primary objectives were met. Additionally, a number of cursory objectives were accomplished. This includes the sending of a proposal to the TWAM hospital to participate in another data mining project. 8.5 Further Work There are a number of ways the work can be expanded. The knowledge gained could be updated to establish new rules for classification accuracy. There is also the possibility that an application with a continuous knowledge base of diabetic records could be established. This software could be used to diagnose the patients and make suggestions. Clustering techniques could be applied to the medical data for increased predictive accuracy. Finally, the software could potentially perform automatic relevance analysis. 9. Conclusion 9.1 Aims & Objective Achievement This section considers how well the aims and objectives were carried out. Acquiring the model data for a particular disease (Diabetes), the date should be a real-patients data. This aspect of the project proved to be perhaps the most difficult. While I originally assumed that I would simply need to contact the hospitals I came to recognize that there were a number of restrictions. Still, after filing out the necessary ethical forms I found that it was able to obtain the needed information. Learn and use pre-processing techniques to prepare the data for mining. A number of techniques were used for data mining. Notably, I used SQL queries to identify inconsistent data. Research in Data mining techniques and apply some of them. This was a new aspect of research for me. Still after hard work and deliberation I found the data mining tools at my disposal to be of great help and illumination. Survey some existing data mining case and educate myself with WEKA. Perhaps the most important consideration in these regards was simply reading about the use of data mining in the medical field. After this I came to recognize that I must learn the WEKA software. I became intimately familiar with this software in the process. Produce knowledge and pattern of interest as well as testing the results. The implementation of the data mining techniques resulted in the establishment of strong results and pathways that can be incorporated by medical staff in future decisions. General/Personal aims & objectives and the evolution of the final investigation results. All the primary aims of the project were met. I believe my personal goals to a great degree were reached as in the process of the research I advanced both personally and intellectually in a multitude of contexts. 9.2 Unexpected Problems As noted earlier the major unexpected hurdle I had to overcome was obtaining the patient information. This problem was overcome through the filling out of forms. Another problem faced was missing values. Early on I realized this was a crucial area of concern as it could potentially compromise the project. This was overcome through considerable attention to the literature review of medical data and aid from SQL. Finally commitment to other module assignments became a significant challenge. It was at first very difficult to adequately balance a variety of disparate responsibilities, but with time I came to understand the most efficient means how. 9.3 Reflections & Possible Improvements While at first I was apprehensive in entering into such a project because of my lack of experience in retrospect I am glad I took on the challenge. It has expanded my knowledge of data mining and given me the confidence that I can take on difficult things in my life and through hard work and dedication persevere through them. If any improvements could be made it would be through the application of more data mining techniques and special software for medical staff. Ultimately, I believe that the project was ultimately a success. Read More
Cite this document
  • APA
  • MLA
  • CHICAGO
(“Dataming testing Essay Example | Topics and Well Written Essays - 4000 words”, n.d.)
Retrieved from https://studentshare.org/information-technology/1396368-dataming-testing
(Dataming Testing Essay Example | Topics and Well Written Essays - 4000 Words)
https://studentshare.org/information-technology/1396368-dataming-testing.
“Dataming Testing Essay Example | Topics and Well Written Essays - 4000 Words”, n.d. https://studentshare.org/information-technology/1396368-dataming-testing.
  • Cited: 0 times

CHECK THESE SAMPLES OF Testing as an Essential Aspect of the Research

Learning from the Cognitive and the Sociocultural Perspective

The most significant of these studies concerning the cognitive perspective, however, had been those dealing with the aspect of category learning.... In the paper “Learning from the Cognitive and the Sociocultural Perspective” the author explains, using specific research examples, how learning has been studied from the cognitive perspective and the sociocultural perspective.... Earlier research and experiments in this field have found that animals could form generalizations out of the learned responses to stimuli other than those to which they had already formed a stimulus-response relationship (Littleton, Toates and Braisby, 2002)....
4 Pages (1000 words) Research Proposal

Podcasts for Training in an Organisational Setting

the research investigates the potential of the podcasting as a technological tool to improve training in an organizational setting.... The proposal discusses the perceived relevance of intended research, as it outlines the ability of the podcasting to quantifiably enhance training in a subject area.... The term podcasting, for the purpose of this research, refers to a technological tool that is mobile and has the capacity for internet communication, multimedia playback, and storage....
11 Pages (2750 words) Research Proposal

Psychological research

hellip; the research has been conducted by way of a memory test on two groups of subjects, one the control group and the other the experimental group for whom external stimulus was introduced in order to study the impact on memory performance.... the research has been conducted by way of a memory test on two groups of subjects, one the control group and the other the experimental group for whom external stimulus was introduced in order to study the impact on memory performance....
4 Pages (1000 words) Research Paper

Management of Preoperative Fasting

This statistics may become supporting evidence that preoperative fasting is an essential process in making the statistical morbidity in elective surgery minimal.... This is the principal issue in the present research of preoperative fasting, and this issue needs to be addressed on the state level through the development of the new policies in fasting.... It is essential to consider the process from the different viewpoints, through its limitations and weaknesses on the basis of the clinical practices and state policies....
21 Pages (5250 words) Research Paper

Costing Techniques Benefits for JetBlue

the research incorporates analyzing such costing techniques by associating the same in context of JetBlue.... the research technique followed is essentially qualitative.... JetBlue tries to create differentiation in their service offerings by incorporating the aspect of quality, which most low cost carriers are seen to emphasize less upon.... The study essential follows a descriptive and an interpretative approach....
15 Pages (3750 words) Research Paper

CT Testing Prior to Bone Scan Testing

This paper highlights that the Purpose of this research project is to identify whether or not CT contrast, when administered for CT testing prior to bone scan testing, has an effect on image quality and diagnosis following a bone scan, in the event that both tests are administered on the same day....
16 Pages (4000 words) Research Paper

Integration Testing and Systems Testing

The primary objectives of the paper “Integration testing and Systems testing” are to deliver the systems with optimum practical effectiveness including reliability, efficiency, safety, quality, maintainability, scalability, upgradeability, and cost-effectiveness.... hellip; The author states that Systems Engineering is associated with conceptualizing, design, development, testing & make-live of large scale & complex engineering systems for various industrial & software applications....
18 Pages (4500 words) Research Paper

Research Strategy-Qualitative and Quantitative Aspects

Testing is additionally an essential part of the exploration strategy.... The paper “research Strategy-Qualitative and Quantitative Aspects” seeks to evaluate methodology in research, which can be said to refer to the planned hypothetical strategy appropriate in the field of exploration.... research strategy directs the analyst and goes about as the controlling guide for them.... research tools such as questionnaires are powerful for leading quantitative surveys....
18 Pages (4500 words) Research Paper
sponsored ads
We use cookies to create the best experience for you. Keep on browsing if you are OK with that, or find out how to manage cookies.
Contact Us