StudentShare

Our website is a unique platform where students can share their papers in a matter of giving an example of the work to be done. If you find papers
matching your topic, you may use them only as an example of work. This is 100% legal. You may not submit downloaded papers as your own, that is cheating. Also you
should remember, that this work was alredy submitted once by a student who originally wrote it.
✕
Free
Nutritional Analyses Based on 7 Day Food Consumption - Research Proposal Example
Summary
This research proposal "Nutritional Analyses Based on 7 Day Food Consumption" presents an important part of staying healthy. What food and you take and in what proportion matters a lot. All food has different proportions of energy, protein, vitamin, minerals, fat, carbohydrate, etc…
- Subject: Health Sciences & Medicine
- Type: Research Proposal
- Level: Ph.D.
- Pages: 4 (1000 words)
- Downloads: 0
- Author: connellyviolett
Extract of sample "Nutritional Analyses Based on 7 Day Food Consumption"
Nutritional Analyzes Introduction Die analysis is an important part in staying healthy. What food and you take and in what proportion matters a lot. All food has different proportion of energy, protein, vitamin, minerals, fat, carbohydrate etc. Analyzing our food intake helps us to know about all proportion and thus we can manage our food intake to reach GOAL values of energy, protein, vitamin, minerals, fat, carbohydrate etc.
This is the diet analysis research project. I am 24, Male, 150 lbs and 5.6”. In this project I kept record of the entire food intake and calculated average intake for energy, protein, carbohydrate, fat, fiber etc. Then I compared my average intake with GOAL intake and Intake of people with similar height, weight, activity level, BMI. At last I tried to find solution for achieving required diet.
METHOD
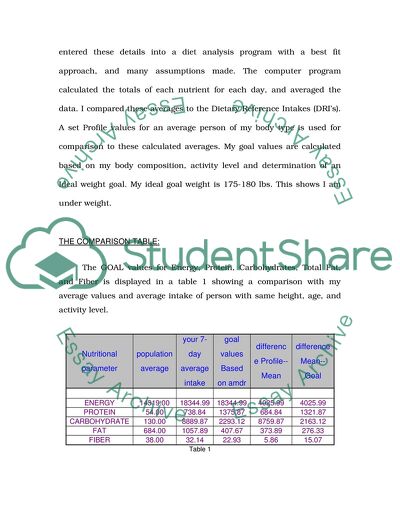
I recorded everything I eat and drink for 7 days seven consecutive days, recording both what I am consuming and how much. Then I entered these details into a diet analysis program with a best fit approach, and many assumptions made. The computer program calculated the totals of each nutrient for each day, and averaged the data. I compared these averages to the Dietary Reference Intakes (DRI’s). A set Profile values for an average person of my body type is used for comparison to these calculated averages. My goal values are calculated based on my body composition, activity level and determination of an Ideal weight goal. My ideal goal weight is 175-180 lbs. This shows I am under weight.
THE COMPARISON TABLE:
The GOAL values for Energy, Protein, Carbohydrates, Total Fat, and Fiber is displayed in a table 1 showing a comparison with my average values and average intake of person with same height, age, and activity level.
Nutritional parameter
population average
your 7-day average intake
goal values Based on amdr
difference Profile-- Mean
difference Mean-- Goal
ENERGY
14319.00
18344.99
18344.99
4025.99
4025.99
PROTEIN
54.00
738.84
1375.87
684.84
1321.87
CARBOHYDRATE
130.00
8889.87
2293.12
8759.87
2163.12
FAT
684.00
1057.89
407.67
373.89
276.33
FIBER
38.00
32.14
22.93
5.86
15.07
Table 1
THE DAILY FOOD GUIDE:
The number of servings and/or quantity of each food group I consume is estimated and compared to the recommended serving distribution for my average Caloric intake discussed in the Daily Food Guide.
Daily Food Guide
Recommended Servings
Average Servings
Grains
10
3.57
Vegetables
4
3
Fruits
2.50
1
Dairy
3
10
Meat
7
17
Table 2
MICRONUTRIENTS
The computer programs average my vitamin and mineral intake and report those values. I created a table reporting the results of comparison between my average values and established AI’s or RDA’s.
VITAMINS
MICRONUTRIENT
RDA/AI
7 DAY AVERAGE
DIFFERENCES
THIAMIN
1.20
4.06
2.86
RIBOFLAVIN
1.30
9.39
8.09
NIACIN
16
10.56
5.44
VITAMIN B6
1.30
11.56
10.26
FOLATE
400
197.56
202.44
VITAMIN B12
2.60
11.67
9.07
VITAMIN C
90
231.18
141.18
VITAMIN A
900
613.69
286.31
VITAMIN D
5
1.78
3.22
VITAMIN E
15
8.22
6.78
Table 3
MINERALS
MICRONUTRIENT
RDA/AI
7 DAY AVERAGE
DIFFERENCES
CALCIUM
1000
237.49
762.51
PHOSPHOROUS
700
680.94
19.06
MAGNESIUM
400
376.20
23.80
IRON
8
7.11
0.89
ZINC
11
8.72
2.28
COPPER
1
8.22
7.32
Table 4
DISCUSSION
Comparison of my average intake and GOAL values shows that my energy consumption is perfect. But I need to Increase protein consumption to reach 30% Goal value, although these values are very high as compared to average nutritional parameters. Again carbohydrate and fat consumption is very high compared to GOAL value. Primary resources for my energy consumption are chicken, Tilapia and flex oil. So to decrease my fat consumption I need to decrease these intakes. Carbohydrate consumption is mainly because of protein shake, rice, black beans, steak and vegetables. So I need to keep consumption of such food items also in control. At the same time I need to increase intake of food items which gives me higher energy and protein so as to compensate for decrease in other nutritional parameters. As per calculation my fiber consumption is also high. But still in range of average consumption of people with similar height, weight, activity level and BMI so no need to take any action.
Comparison of my average serving and recommended serving shows I need to increase my grains and fruits intake. As a resultant my protein intake will increase. At the same time Meat and dairy items need to decrease which are responsible for higher proportion of Carbohydrate and fat.
Comparison between my average vitamins and minerals intake and RA’ recommendation is shown in a table 3 and 4. It shows that consumption for calcium and zinc need to increase which can be done by increasing intake of protein shake, potato, beans etc. Other Minerals like phosphorous, magnesium and iron are well in control. Still Copper intake has to decrease by great amount. Vitamin intake like niacin, folate, vitamin A, D and E need to increase. Possible sources for these are egg protein shake, steak etc. At the same time intake for thiamin, riboflavin, vitamin B6, vitamin B12 and vitamin C need to decrease by great proportion. Again this can be done by decreasing fruit, beans, chicken etc.
CONCLUSION
Analysis of all food intake and comparing those with that of GOAL values and recommended intake shows that all food I consume are responsible for deficiency or excess of one or other nutritional parameter. Increase in intake of one food item in order to improve inadequacy of one parameter result in creating excessiveness in other parameter. So balanced diet has to be decided which provide required nutrition at the same time do not disturb proportion of other parameters.
It shows that to improve deficiency of calcium, Folate and Vitamin A and Vitamin C proportion of egg, protein shake, multivitamin, steak, and mixed vegetables has to increase in my food intake. At the same time these food items are responsible for increase in carbohydrate and fat percentage. Similarly, decreasing chicken and dairy intake, in order to control fat proportion, results in deficiency of protein, Niacin, Vitamin B6, phosphorous and vitamin B12. Thus improved diet plan can be decided consider all these factors in to consideration.
Read
More
sponsored ads
Save Your Time for More Important Things
Let us write or edit the research proposal on your topic
"Nutritional Analyses Based on 7 Day Food Consumption"
with a personal 20% discount.
GRAB THE BEST PAPER
