StudentShare
Contact Us
Sign In / Sign Up for FREE
Search
Go to advanced search...
Free

Production of EPA by the Diatom - Coursework Example

Cite this document
Summary
This experiment “Production of EPA by the Diatom” seeks to determine the ideal and optimum combination of factors in the production of EPA. The experiment will use the diatom, Nitzschialaevis. Treatments to be used in the experiment are PI metal solution…
Download full paper File format: .doc, available for editing
GRAB THE BEST PAPER96.7% of users find it useful
Production of EPA by the Diatom
Read Text Preview

Extract of sample "Production of EPA by the Diatom"

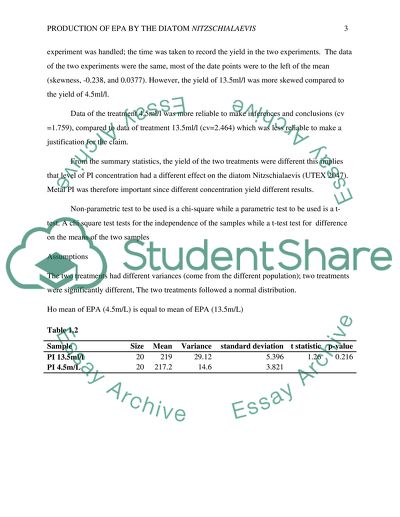
Production of EPA by the Diatom Introduction The therapeutic significance of ώ-3 polyunsaturated fatty acids (ώ -3 PUFAs) demonstrated by recent clinical studies. Eicosapentaenoic acid (EPA), along with docosahexaenoic acid (DHA), plays an important role in the prevention of arrhythmia, cardiovascular disease, and cancer. Fish oil is the main source of both EPA and DHA; production of -3 PUFAs from fish oil is affected by different factors such asstability problems, high purification costs and contamination with pesticides and heavy metals. This experiment seeks to determine ideal and optimum combination of factors in production of EPA. The experiment will use the diatom, Nitzschialaevis,. Treatments to be used in experiment PI metal solution (Cepák, Přibyl, Kohoutková, & Kaštánek, 2014). The source of variation in experiment one is the treatment (PI solutions) used in the experiment. A PI solution of 4.5m/L and 3.5m/L used in the experiment will yield different yields in EPA. The treatment used in the experiment will account for the variation in the experiment. Table 1.1 Summary statistics EPA (13.5m/l) EPA (4.5m/l) Mean 219 217.2 Median 220.1 217.5 Standard deviation 5.396 3.821 Variance 29.12 14.6 Coefficient of variation 2.464 1.759 Skewness -0.238 -0.0377 From table 1.1 EPA 13.5ml/l had the highest EPA yield (mean = 219.5) compared to EPA 4.5 (mean=217.2). It implies that PI of the concentration of 13.5ml/l had a higher EPA yield. There was a big disparity yield of PI EPA 13.5ml\l (standard deviation =5.396) compared to EPA 4.5ml/l (standard deviation =3.821) this implies that yield of 13.5 PI was less spread compared to yield in 4.5 PI, which was more spread. It could be assumed to the way the experiment was handled; the time was taken to record the yield in the two experiments. The data of the two experiments were the same, most of the date points were to the left of the mean (skewness, -0.238, and 0.0377). However, the yield of 13.5ml/l was more skewed compared to the yield of 4.5ml/l. Data of the treatment 4.5ml/l was more reliable to make inferences and conclusions (cv =1.759), compared to data of treatment 13.5ml/l (cv=2.464) which was less reliable to make a justification for the claim. From the summary statistics, the yield of the two treatments were different this implies that level of PI concentration had a different effect on the diatom Nitzschialaevis (UTEX 2047). Metal PI was therefore important since different concentration yield different results. Non-parametric test to be used is a chi-square while a parametric test to be used is a t-test. A chi square test tests for the independence of the samples while a t-test test for difference on the means of the two samples Assumptions The two treatments had different variances (come from the different population); two treatments were significantly different, The two treatments followed a normal distribution. Ho mean of EPA (4.5m/L) is equal to mean of EPA (13.5m/L) Table 1.2 Sample Size Mean Variance standard deviation t statistic p-value PI 13.5ml/l 20 219 29.12 5.396 1.26 0.216 PI 4.5m/L 20 217.2 14.6 3.821 From the t-test for paired samples (t =12.6, p=0.216) indicate weak evidence and against the p-value hence we fail to reject the null hypothesis. It implies that for any given level of concentration yield of EPA is not significantly affected. However, PI of 13.5ml/l yields a higher mean value than 4.5ml/l but they are no significantly different (Wah, Ahmad, Chieh, & Hwai, 2015). The difference in 13.5ml/l means with 4.5ml/l means 1.860; this implies that 13.5ml/l yields 1.860 more EPA than a concentration of 4.5ml/l. Chi-square test for independence of two samples Assumptions; the two samples are uncorrelated, and are independent Table 1.3 Chi-Square test Value df Asymp. Sig. (2-sided) Pearson Chi-Square 300.000 288 0.301 Likelihood Ratio 108.739 288 1 Linear-by-Linear Association 0.068 1 0.794 From table 1.3 there is weak (p=0.301) evidence against Ho testing for linear independence between the yield of two different concentrations of PI. Hence, we fail to reject the null hypothesis. It implies that statistically there is no difference between the yields of the two PI concentration levels. It reveals that PI is not the best variable to test for yields in EPA. Multiple Regressions The multiple regression models will take the form Where Y is EPA yield, X1is the pH value, X2 the NaCl level and X3 the temperature level. is the prediction error or residual. The last part of the model represents interactions effects between the independent variables in the model. It is important to test if two variables can be combined together for optimum yield (Sharma, Schuhmann, & Schenk, 2012). Assumptions Assumptions that are to be met before a linear regression is run is variables should be linearly related and variables should follow multi normal distributions. This can be checked by plotting scatter plots and box plots Figure 1 scatter diagram From the scatter diagram, it indicates that there is linear relationship between independent and dependent variables. Assumption of linearity is fulfilled to carry out a linear regression. The linearity is not optimal therefore there is need to transform the variables by squaring. Figure 2 Box plot From the box plot three independent variables follows a normal distribution. This fulfills the assumption for linear regression. Table 1.4 Model Summary Model R R Square Adjusted R Square Std. Error of the Estimate 1 .947 0.898 0.844 20.36982 The model summary table indicate that 84.4% variation in EPA yield was explained by NACL, PH, temperature, temperature-squared, ph-squared, and NACL-squared. This was ideal model since almost all the variation was explained by the explanatory variables. Table 1.5 ANOVA Model Sum of Squares df Mean Square F Sig. 1 Regression 61906.2 9 6878.466 16.577 .000 Residual 7053.805 17 414.93 Total 68960 26 Dependent Variable: YIELD From the model the regression was significant (F (9,27) p=0.000) this implies that explanatory variables in the experiment explained for the variation in the EPA yield. The regression was thus significant at 0.01, significance level and therefore used to make inferences and conclusions concerning effect of ph, temperature and Nacl on yield of EPA. Table 1.7 Coefficients Unstandardized Coefficients Standardized Coefficients t Sig. 95.0% Confidence Interval for B B Std. Error Beta Lower Bound Upper Bound Constant -1930 1222.24 -1.579 0.023 -4508.7 648.705 PH 457.375 263.717 4.266 1.734 0.035 -99.02 1013.77 PHSQ -34.559 16.632 -4.838 -2.078 0.053 -69.65 0.531 Nacl -7.127 22.849 -0.532 -0.312 0.759 -55.335 41.08 NACLSQ 0.18 0.26 0.434 0.694 0.497 -0.368 0.729 TEMP 56.331 33.31 3.153 1.691 0.001 -13.947 126.61 TEMPSQ -2.06 0.462 -5.085 -4.458 0.000 -3.034 -1.085 PH*TEMP 3.021 3.395 1.413 0.89 0.386 -4.142 10.184 PH*NACL 0.553 2.546 0.321 0.217 0.831 -4.819 5.925 TEMP*NACL -0.209 0.424 -0.392 -0.492 0.629 -1.104 0.686 From the coefficient table the intercept was significant (p=0.023, -1930), pH was significant (p=0.035 4757.375). NACL was insignificant (p=0.759, -7.127), temperature was significant (p=0.001, 56.331) PH-squared was insignificant (p=0.053, -34.559), Nacl-squared was insignificant (p=0.497, 0.18). Temperature-squared was significant (p=0.000, -2.06). Interactions between temperature and PH was insignificant (p=0.386,3.021), interaction between PH and Nacl was insignificant (p=0.831, 0.553) and interaction between temperature and Nacl was insignificant (p=0.629,-0.029) General model equation would be EPA Yield =-1930 + 457.375PH -34.559PHSQ -7.12NACL +0.18NACLSQ +56.331TEMP -2.06TEMPSQ+3.021PHTEMP +0.553PHNACL -0.209TEMPNACL +20.36982 ERROR TERM. EPA yield can only be predicted by, TEMP TEMP-SQ and Intercept which are significant variables. A simplified equation for the model would be EPA YIELD = -1930 +457.37PH +56.33 TEMP -2.06 TEMP-SQ The equation reveals that with all factors of EPA yield kept constant there is negligible -1930 yield of EPA. For every change in the unit PH, there is an addition yield of 457.37 in EPA yield. A unit change in temperature leads to an additional yield of 56.33 in EPA yield. A unit change in temperature reduces the yield of EPA by -2.06. This reveals that PH level affect the rate of EPA yield, increase in PH makes the microorganism work at optimum to increase the yield of EPA Temperature affect the yield of EPA, increase in temperature increases the rate of EPA yield. For the maximization of the EPA yield, temperature and PH should be at it optimum. Optimum here implies that a level where the temperature does no inhibit the activities of microorganisms (Geiringer & Griffiths, 2014). There is sufficient evidence to conclude that the intercept of the model lies between (-4508.7, 648.705) at 95% confidence interval. There is enough proof to conclude that the PH coefficient of the model lies between (-99.02, 1013.77), at 95% confidence interval. There is enough proof to conclude that the temperature coefficient of the model lies between (-13.947, 126.61) at 95% confidence interval There is sufficient evidence to conclude that the temperature square of the model between (-3.034,-1.085), at 95% confidence interval. Conclusion From the experiment there was no significant difference in yields on PI solutions this implies that concentration of PI solution does not affect the production of EPA at constant temperature and PH level. PI solution cannot be used to optimize the yield of EPA, changing the medium components significantly affected the yield in EPA. PH and temperature significantly affected the yield of EPA which Nacl did not significantly affected the yield of EPA. This implies that production of EPA can be optimized by changing the temperature of the environment and PH of medium components (Mühlroth, Li, Røkke, Winge, Hohmann-Marriott, & Bones, 2013). Interacting PH and temperature cannot optimize yield of EPA, this is because of the variability in the individual environmental factor optimization levels. References Sharma, K. K., Schuhmann, H., & Schenk, P. M. (2012). High lipid induction in microalgae for biodiesel production. Energies, 5(5), 1532-1553. Geiringer, K. T., & Griffiths, H. D. (2014). U.S. Patent No. 8,877,465. Washington, DC: U.S. Patent and Trademark Office. Wah, N. B., Ahmad, A. L. B., Chieh, D. C. J., & Hwai, A. T. S. (2015). Changes in Lipid Profiles of a Tropical Benthic Diatom in different Cultivation Temperature. Asian Journal of Applied Science and Engineering, 4(2), 91-101. Mühlroth, A., Li, K., Røkke, G., Winge, P., Olsen, Y., Hohmann-Marriott, M. F., ... & Bones, A. M. (2013). Pathways of lipid metabolism in marine algae, co-expression network, bottlenecks and candidate genes for enhanced production of EPA and DHA in species of Chromista. Marine drugs, 11(11), 4662-4697. Cepák, V., Přibyl, P., Kohoutková, J., & Kaštánek, P. (2014). Optimization of cultivation conditions for fatty acid composition and EPA production in the eustigmatophycean microalga Trachydiscus minutus. Journal of applied phycology, 26(1), 181-190. Read More
Cite this document
  • APA
  • MLA
  • CHICAGO
(“Production of EPA by the Diatom Coursework Example | Topics and Well Written Essays - 1500 words”, n.d.)
Production of EPA by the Diatom Coursework Example | Topics and Well Written Essays - 1500 words. Retrieved from https://studentshare.org/health-sciences-medicine/1702322-optimisation-of-the-heterotrophic-production-of-epa-by-the-diatom-nitzschia-laevis
(Production of EPA by the Diatom Coursework Example | Topics and Well Written Essays - 1500 Words)
Production of EPA by the Diatom Coursework Example | Topics and Well Written Essays - 1500 Words. https://studentshare.org/health-sciences-medicine/1702322-optimisation-of-the-heterotrophic-production-of-epa-by-the-diatom-nitzschia-laevis.
“Production of EPA by the Diatom Coursework Example | Topics and Well Written Essays - 1500 Words”, n.d. https://studentshare.org/health-sciences-medicine/1702322-optimisation-of-the-heterotrophic-production-of-epa-by-the-diatom-nitzschia-laevis.
  • Cited: 0 times

CHECK THESE SAMPLES OF Production of EPA by the Diatom

Change Management Plan for IBM

Business Management IBM, an international company for computer, hardware and software services is involved in this case with a managerial perspective to address some key issues and challenges.... In the early 1980s, the company faced huge losses and a major decline in its market share after the advent of personal computers....
12 Pages (3000 words) Essay

Hazardous Effects of Ionizing Radiation

The main objective of the paper “Hazardous Effects of Ionizing Radiation” is to be able to critically present and analyse the views regarding the use of ionizing ration specifically in relation to the layman or public perspective as well as the scientific perspective....  … The paper is focused on presenting the concepts and issues related to the hazardous effects of ionizing radiation by exploring the information available to the public and the information that can be gathered from academic and scientific resources....
7 Pages (1750 words) Research Paper

Rules for EPA and Sopa Culture

In the essay “epa & Sopa Culture” the author discusses the main differences between the epa group and the Sopa group of cultures.... epa's conclusion is that they are nothing but just a part of nature and for nature is as sacred as humans....
1 Pages (250 words) Essay

Bioengineered foods are they safe

Department of Agriculture), the epa (Environmental Protection Agency) and the FDA (Food and Drug Administration).... The concept is not new but along with the increasing amount of bioengineered food appearing in the marketplace Some have termed the genetically manipulated crops ‘frankenfoods' and have questioned the potential harm to people and the environment that could come from their production....
4 Pages (1000 words) Essay

Genetically Modified Crops

Department of Agriculture), the epa (Environmental Protection Agency) and the FDA (Food and Drug Administration).... The concept is not new but along with the increasing amount of bioengineered food appearing in the Some have termed the genetically manipulated crops ‘frankenfoods' and have questioned the potential harm to people and the environment that could come from their production....
6 Pages (1500 words) Essay

Diatoms Species as Indicators of Ecosystem Disturbance

This carapace is one the key fundamental feature and a point of reference used by scientists all over the world as a mode of distinguishing the diatom species fall under Bacillariophyta taxa.... These pores are crucial in that they allow efficient gaseous exchange within the diatom.... the diatom research analysis majoring on carpenter Bayou water systems where samples of mud, mineral debris, and organic matter were collected dating to 2015, January....
3 Pages (750 words) Essay

Hazardous Effects of Ionizing Radiation

This work called "Hazardous Effects of Ionizing Radiation" describes views regarding the use of ionizing ration specifically in relation to the layman or public perspective as well as the scientific perspective.... The author outlines that there is very less confusion on the view of the public that radiation is very hazardous to human health....
6 Pages (1500 words) Research Paper

Gasohol in America: Dubious Present, Promising Future

… The paper "Gasohol in America: Dubious Present; Promising Future?...  is a worthy example of an assignment on environmental studies.... One of the principal technological challenges for humankind today is an effort to reduce our use of fossil fuels by substituting the use of renewable energy sources....
9 Pages (2250 words) Assignment
sponsored ads
We use cookies to create the best experience for you. Keep on browsing if you are OK with that, or find out how to manage cookies.
Contact Us