StudentShare
Contact Us
Sign In / Sign Up for FREE
Search
Go to advanced search...
Free

Modelling the Amount of a Drug in the Bloodstream - Term Paper Example

Cite this document
Summary
The paper "Modelling the Amount of a Drug in the Bloodstream" highlights that the amount of drug in the bloodstream never becomes zero and some amount of drug always remains in the bloodstream. The reason for this is that the value of the exponential function never becomes zero…
Download full paper File format: .doc, available for editing
GRAB THE BEST PAPER96.1% of users find it useful
Modelling the Amount of a Drug in the Bloodstream
Read Text Preview

Extract of sample "Modelling the Amount of a Drug in the Bloodstream"

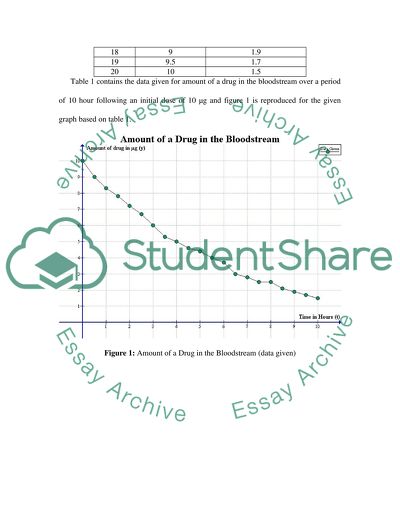
Math Portfolio: Modelling the Amount of a Drug in the Bloodstream This math portfolio investigates and models the amount of a drug for treating malaria in the bloodstream over a period following an initial dose. In the first part A, initially an investigation will be made for finding a suitable function to model data given over a period of 10 hours following an initial dose of 10 μg. After that, graph of this model function will be compared with the data given so that suitability of the model function can be derived (known). In the second part B, the affect of doses given every six hour will be checked with and without using model function. In addition, it will be also checked that what happen if no further doses is given to malaria patient over a week period after an initial dose of 10 μg. Table 1: Amount of a Drug in the Bloodstream (data given, from graph) No. Time in Hours (t) Amount of drug in µg (y) 0 0 10 1 0.5 9 2 1 8.3 3 1.5 7.8 4 2 7.2 5 2.5 6.7 6 3 6 7 3.5 5.3 8 4 5 9 4.5 4.6 10 5 4.4 11 5.5 4 12 6 3.7 13 6.5 3 14 7 2.8 15 7.5 2.5 16 8 2.5 17 8.5 2.1 18 9 1.9 19 9.5 1.7 20 10 1.5 Table 1 contains the data given for amount of a drug in the bloodstream over a period of 10 hour following an initial dose of 10 μg and figure 1 is reproduced for the given graph based on table 1. Figure 1: Amount of a Drug in the Bloodstream (data given) PART A 1. Use this information to help you find a suitable function to model this data. From The graph of the given data, it is obvious that the amount of drug in the bloodstream decreases as the time passes. From investigation, it is found that it is similar to the graph of an exponential decay function (for example radioactive decay graph). The general equation of such an exponential decay function is: Where, is the initial amount , is the amount after time t, k is the decay constant, and b is the constant and can have value 2, 3, 4, … or e (mathematical constant, approximately equal to 2.718281828459). For the calculation purpose, it useful to take the value of b as e, therefore, the equation becomes: For our model function, let and, therefore equation becomes Where, is the initial amount of the drug , is the amount of drug after time t, is the decay constant, From data given, at the start, the amount is 10 µg, therefore the value of initial amount will be 10 µg i.e. . Putting this value of in the model function, the model function becomes: Now for determining the value of decay constant, solving above model function for. From the above function, the different values of can be determined for the given data that is summarized in table 2. Since, there are different values of for every data points, therefore, for our model function taking average value (mean value) of from the calculated values of ,. Average value of k = (Taking only four decimal places) Therefore model function will be: Table 2: Different values of decay constant (k) for the given data No. Time in Hours (t) Amount of drug in µg (y) Value of decay constant 0 0 10 1 0.5 9 0.2107 2 1 8.3 0.1863 3 1.5 7.8 0.1656 4 2 7.2 0.1643 5 2.5 6.7 0.1602 6 3 6 0.1703 7 3.5 5.3 0.1814 8 4 5 0.1733 9 4.5 4.6 0.1726 10 5 4.4 0.1642 11 5.5 4 0.1666 12 6 3.7 0.1657 13 6.5 3 0.1852 14 7 2.8 0.1819 15 7.5 2.5 0.1848 16 8 2.5 0.1733 17 8.5 2.1 0.1836 18 9 1.9 0.1845 19 9.5 1.7 0.1865 20 10 1.5 0.1897 2. Draw a graph of your function and compare your graph to the one above. Figure 2 shows the Graph of model function and data given. From figure 2 , it can be seen that the graph of model function and data given are similar and approximately follows the same path. Some minor deviations may be because of the error in colleting the data for the amount of drug in the bloodstream over a period. Figure 2: Graph of model function and data given 3. Comment on the suitability of the model. The model functionis suitable for the modeling of amount of the drug in the bloodstream. The suitability of the model function is also derived from the comparison of the graph of model function and data given and both are similar. PART B A patient is instructed to take 10 μg of this drug every six hours. 1. Sketch a diagram to show the amount of the drug in the bloodstream over a 24-hour period and state any assumption made. From given graph of amount of drug in the bloodstream for 10-hour period following an initial dose of 10 μg, it can be seen that amount of drug remained in the bloodstream after six-hour period is equal to 3.7 μg. Therefore, in six-hour period the amount of drug decay is 6.3 μg. Assuming this decay-rate is constant for further period, when a patient is instructed to take 10 μg of this drug every six hours. Then, the amount of drug at start and at end of each period will be as given in table 3. The maximum amount of drug 21.1 μg in the bloodstream will be at start of fourth period (i.e. 18-24 hour period) and the minimum amount of drug 3.7 μg in the bloodstream will be at end of first period (i.e. 0-6 hour period). Table 3: Amount of drug (based on data given) for 24-hour period Period Initial amount at start of period (µg) Amount at end of period (µg) 0-6 (1st ) 10 3.7 (min) 6-12 (2nd ) 13.7 7.4 12-18 (3rd ) 17.4 11.1 18-24 (4th ) 21.1 (max) 14.8 Figure 3 shows the sketch (graph) of the amount of the drug in the bloodstream over a 24-hour period assuming constant decay-rate of 6.3 μg over a period of six hours. Figure 3: Amount of drug (based on data given) for 24-hour period 2. Use your GDC or graphing software and your model from part A to draw an accurate graph to represent this situation. Table 4 summarizes the amount of drug in the bloodstream at start and at end of each period using the model function derived in part A. Table 4: Amount of drug based on model function for 24-hour period Period Initial amount at start of period (µg) Amount at end of period (µg) 0-6 (1st ) 10 3.45 (min) 6-12 (2nd ) 13.45 4.64 12-18 (3rd ) 14.64 5.05 18-24 (4th ) 15.05 (max) 5.19 Using model function, the maximum amount of drug 15.05 μg in the bloodstream will be at start of fourth period (i.e. 18-24 hour period) and the minimum amount of drug 3.45 μg in the bloodstream will be at end of first period (i.e. 0-6 hour period). Figure 4 shows the graph of the amount of the drug in the bloodstream over a 24-hour period Using model function. Figure 4: Amount of drug based on model function for 24-hour period 3. State the maximum and minimum amounts during this period. Maximum amounts of Drug = 15.05 μg Minimum amounts of Drug = 3.45 μg 4. Describe what would happen to these values over the next week if: (a) No further doses are taken. Figure 5: Amount of drug for week period (no further dose) If, after first dose no further dose is given to malaria patient, than the graph of amount of drug in the bloodstream for a week period will be given by figure 5. From figure 5, it can be seen that the amount of drug in the bloodstream never becomes zero and some amount of drug always remains in the bloodstream. The reason for this is that the value of exponential function never becomes zero. (b) Doses continue to be taken every six hours. The graph of the amount of drug in the bloodstream at start and at end of each period using the model function for a week period will be similar to figure 4. In this case, it will be plotted for a week period instead of 24-hour period. The table 5 summarizes the amount of drug in the bloodstream at start and at end of each period using the model function for a week period. Here, it can be seen that after certain period the amount of drug at start and at end of period becomes constant (i.e. 15.26 μg and 5.26 μg). Table 5: Amount of drug based on model function for a week period Period Initial amount at start of period (µg) Amount at end of period (µg) 0-6 (1st ) 10 3.45 (min) 6-12 (2nd ) 13.45 4.64 12-18 (3rd ) 14.64 5.05 18-24 (4th ) 15.05 5.19 24-30 (5th ) 15.19 5.24 30-36 (6th ) 15.24 5.25 36-42 (7th ) 15.25 5.26 42-48 (8th ) 15.26 (max) 5.26 48-54 (9th ) 15.26 (max) 5.26 54-60 (10th ) 15.26 (max) 5.26 ---- ---- ----- Figure 6 shows the graph of the amount of the drug in the bloodstream over a week period using model function. Figure 6: Amount of drug based on model function for week period References: Radioactive Curves and Calculations, retrieved on February 28, 2008 from http://curvebank.calstatela.edu/radiodecay/radiodecay.htm How models are derived (Example model 2. Exponential decay), retrieved on February 28, 2008 from http://www.graphpad.com/curvefit/how_to_derive.htm Graphs of Exponential Growth/Decay, retrieved on February 28, 2008 from http://serc.carleton.edu/introgeo/teachingwdata/Graphsexponential.html Exponential Decay, retrieved on February 28, 2008 from http://www.intmath.com/Exponential-logarithmic-functions/2_Graphs-exp-log-fns.php Read More
Cite this document
  • APA
  • MLA
  • CHICAGO
(Math portfolio Term Paper Example | Topics and Well Written Essays - 1750 words, n.d.)
Math portfolio Term Paper Example | Topics and Well Written Essays - 1750 words. https://studentshare.org/health-sciences-medicine/1544762-math-portfolio
(Math Portfolio Term Paper Example | Topics and Well Written Essays - 1750 Words)
Math Portfolio Term Paper Example | Topics and Well Written Essays - 1750 Words. https://studentshare.org/health-sciences-medicine/1544762-math-portfolio.
“Math Portfolio Term Paper Example | Topics and Well Written Essays - 1750 Words”. https://studentshare.org/health-sciences-medicine/1544762-math-portfolio.
  • Cited: 0 times

CHECK THESE SAMPLES OF Modelling the Amount of a Drug in the Bloodstream

Asthma and Pathophisiological Template Case Study

Due to edema, mucus plug formation, bronchoconstriction, and remodeling, the amount of oxygen entering the lungs diminish and carbon dioxide retention(Morris, 2011, n.... Lungs primary function is to deliver oxygen into the bloodstream and remove carbon dioxide from the blood.... As Jason suffers from asthma, various structural and functional changes may occur such as airway disturbance, filling of mucous plugs in the airways, larger and numerous mucus-producing cells, edematous bronchioles, increasing number of inflammatory cells infiltrating airways, thickened connective tissue, denuded respiratory epithelium, and increased amount of smooth muscles surrounding the airway....
3 Pages (750 words) Essay

How Malaria Is Caused

According to the authors, when a person is bitten by a female mosquito, the parasite enters the bloodstream through the mosquito's saliva and then makes its way to the liver.... Malaria Malaria Introduction Malaria is a contagious disease that costs the world several billions of dollars every year....
4 Pages (1000 words) Research Paper

The Toxicity of Nanomaterials

Fish was used as a specimen in this study which showed results that the fish had accumulated nanomaterials in their gills intestine and the bloodstream.... The Toxicity of Nanomaterials Introduction The science of nanotechnology has become popular in the modern world making it a common application for a large number of scientific studies and research....
4 Pages (1000 words) Dissertation

Biology - Infectious Diseases

Instructor Date Infectious Diseases Infectious diseases occur when a parasite infects an organism causing illness and characteristic symptoms to occur.... The parasite may be bacteria, virus, protozoa or fungi.... Most of the infections come with symptoms.... hellip; For example, coughing, high body temperature, pimples, scabs or stomach upsets....
6 Pages (1500 words) Research Paper

THE ROLE OF CONTROLLED DRUG RELEASE IN CANCER THERAPEUTICS

Multi drug Resistance This leads to most of the drugs to have little efficacy unless used in huge doses which will in turn lead to toxic side effects.... The main problem in cancer treatment is the multi-drug resistance of the cancerous cells to chemotherapeutics.... Loss of P53 genes that promotes cell apoptosis, over-expression of bd-z genes that blocks cell death, reduced drug uptake due to damage of foliate carriers, and increased DNA repair (Dass and Choong 2008, p....
10 Pages (2500 words) Essay

Case Study Regarding Asthma

Lungs primary function is to deliver oxygen into the bloodstream and remove carbon dioxide from the blood.... The aim of the study : (1) to explain the process that leads to the structural and functional changes resulting from Jason's asthma; (2) to explain how four of Jason's clinical manifestations are related to the structural and functional changes....
5 Pages (1250 words) Essay

Treatment of Pathophysiological Cases

The paper “Treatment of Pathophysiological Cases” discusses cases of several patients with cardiac failure and atrial fibrillation, rheumatoid arthritis, prostate cancer and metastatic spread to the bones with appropriate symptoms and recommended healing regimens and possible complications....
15 Pages (3750 words) Case Study

The Role of Drug Couriers and Drug Trafficking Industry

They risk not only their personal liberty if caught, but also face the possibility of death due to lethal doses of the drug entering their bloodstream, if a swallowed packet ruptures.... This essay analyzes that drug trafficking is a capital offense in most nations across the globe, including the western democracies, Singapore, Thailand, China, and Egypt.... drug couriers also known as 'mules' “physically transport illegal drugs across international rather than national borders”....
12 Pages (3000 words) Research Paper
sponsored ads
We use cookies to create the best experience for you. Keep on browsing if you are OK with that, or find out how to manage cookies.
Contact Us