StudentShare
Contact Us
Sign In / Sign Up for FREE
Search
Go to advanced search...
Free

Personal Safety - Essay Example

Cite this document
Summary
This paper 'Personal Safety' specifically looks at a survey of individual levels of safety as well as victimization that was experienced by the visitors to Kingston town center in 2011 February. According to the Royal Borough of Kingston every person who goes to Kensington or who resides in this area should always be safe…
Download full paper File format: .doc, available for editing
GRAB THE BEST PAPER96.4% of users find it useful
Personal Safety
Read Text Preview

Extract of sample "Personal Safety"

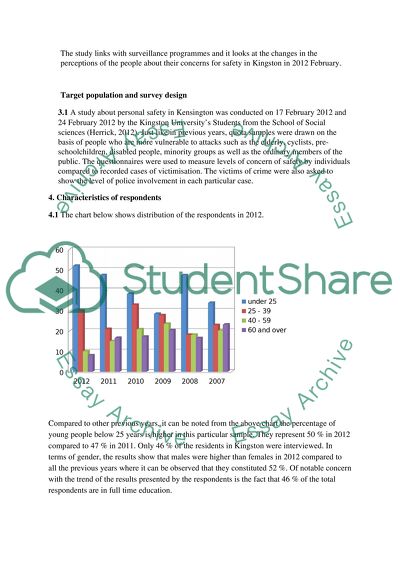
Introduction 1 This report specifically looks at a survey of individual levels of safety as well as victimisation that was experienced by the visitors to Kingston town center in 2011 February. According to the Royal Borough of Kingston upon Thames Partnership plan 2008/11 (2008) every person who goes to Kensington or who resides in this area should always be safe. 2 Context 2.1 It is generally believed that fear of crime itself has probably increased than the prevalent rate of crime in Britain (Jackson, 2006, Cleric and Killias, 2000, Walker, Flatly, Forshow and Mood, 2009). As a result of the prevalence of anti social behaviour such as making noise, vandalism of property, graffiti as well as other related hooliganism, it can be seen that people are now more concerned about their safety than crime itself. As such fear of being a victim of a less serious crime has significantly contributed to behaviour change in residents of Kingston. 2,2 The Crime and Disorder Act of 1988 and The Police Reform Act of 2002 vested power and responsibility within the police force to work hand in hand with other agencies in a bid to develop a three year strategy that was meant to promote safety in the communities (Home Office, 2004). The need to monitor levels of public concern was also increased after the introduction of the Licensing Act 2003, Anti Social Behaviour Act 2004 and Government Strategy for reduction of Harm 2004. An emphasis on the need to strengthen the monitoring challenges arising for new anti social behaviour is found in A New Partnership 2008 -2011 (Home Office, 2008) in conjunction with the studies that were suggested by Kingston police as well as community members. 2.3 The Police and Justice Act 2006 resulted in the amendment of the Crime and Disorder Act 1998 prioritises the aspect of partnerships where a Strategy Group with a certain level of membership is responsible for undertaking strategic assessments on a yearly basis. The issues of concern which are identified through this strategic assessment are put forward in a three year Strategic Plan. The Partnership Plan is comprised of the following aspects: crime and disorder reduction strategy, dealing with unwanted elements of misuse are some of the elements earmarked to be covered by the Partnership Plan over the period of three years. Thus, according to the Royal Borough of Kingston upon Thames Partnership plan 2008/11, there are six areas which are given prominence and these include the following: misuse of alcohol, misuse of drugs, unbecoming behaviour, violence against others, domestic violence, crime related to hate as well as crime committed by youths. 2.4 The use of CCTV across the United Kingdom has been adopted as a strategy to fight crime since these are used to monitor the events obtaining on the ground. Thus, in May 1998, Kensington introduced a centralised CCTV from a controlled center and this system has been extended to the other communities in the neighbourhood and the cameras are used to cover the shopping centers as well as railway stations (Lazell, 2009). 2.5 Since 1998 when the first Kingston Thames Crime audit was unveiled, this objective was attained through constant surveillance of the town center as well as district offices. The study links with surveillance programmes and it looks at the changes in the perceptions of the people about their concerns for safety in Kingston in 2012 February. Target population and survey design 3.1 A study about personal safety in Kensington was conducted on 17 February 2012 and 24 February 2012 by the Kingston University’s Students from the School of Social sciences (Herrick, 2012). Just like in previous years, quota samples were drawn on the basis of people who are more vulnerable to attacks such as the elderly, cyclists, pre-schoolchildren, disabled people, minority groups as well as the ordinary members of the public. The questionnaires were used to measure levels of concern of safety by individuals compared to recorded cases of victimisation. The victims of crime were also asked to show the level of police involvement in each particular case. 4. Characteristics of respondents 4.1 The chart below shows distribution of the respondents in 2012. Compared to other previous years, it can be noted from the above chart the percentage of young people below 25 years is higher in this particular sample. They represent 50 % in 2012 compared to 47 % in 2011. Only 46 % of the residents in Kingston were interviewed. In terms of gender, the results show that males were higher than females in 2012 compared to all the previous years where it can be observed that they constituted 52 %. Of notable concern with the trend of the results presented by the respondents is the fact that 46 % of the total respondents are in full time education. 4.2 The chart below illustrates the purpose of visit by all the respondents. The majority of respondents showed that their main purpose for visit was related to education. The purpose for all other visits has declined in 2012 compared to the previous year, 2011. As noted already, there has been an unprecedented increase in the number of people who travel for the purpose of education whilst during the survey of 2011 and the previous years, the majority of travellers were going for shopping. 4.3 The mode of transport varies given that respondents used different types of transport as shown in the chart below. About 40 %, the highest number of travellers used cars while about 1 % of the respondents used trains. All the other figures are shown below. 4.4 In 2012, 58 % of the respondents showed that they were aware of Kensington Town Center CCTV. Other figures are shown on the chart below. 5. Victimisation and reporting 5.1 The rate of victimisation and muggings are shown in the chart below. There has been a significant decline rate of all incidences related to muggings as shown in the table above. However, there has been an increase in the rate of those people who claim not to be mugged very often given that their rate shot to 48 % in 2012 compared to 42 % in 2011. This means that there has been a decline in the cases of muggings. The majority of the respondents claimed that they have never experienced such scenarios. 5.2 Cases of pick pocketing have significantly declined in 2012 compared to the previous years. The rate of people who claimed to be victims of pick pocketing fell from 6 % in 2011 to 2% in 2012. This is a positive development which shows that the cases of theft are declining hence there is no need for people to fear a lot for crimes of this magnitude. 5.3 Victims of people who claim to have been harassed as a result of elements such as race, disability or sexual orientation are shown in the table below. There has been an increase in the average number of people who claim to be victims of harassment as a result of their physical state. The rate increased from 1,47 % in 2011 to 6 % in 2012. It can be seen that the rate of people who claim that they are not victims of harassment at all declined from 55 % in 2011 to 37 % in 2012. 5.4 The results from the statistics show that there has been a significant decline in cases of cycles being stolen parts of being vandalised. The chart below shows that prevalence of cycle parts being stolen fell from 9 % in 2011 to 0.47 in 2012. Tables 6 and 7 also show the responses of people in terms of their feelings when their cycles are vandalised. 5.5 Theft related to motor cars or vandalism are very rare given that they were not reported during the monitoring period. Only a few cases of cars being broken into were reported during this period. The recorded cases during the monitoring period were lower than 1.5 %. 6. 7. 7.1 In as far as reporting of cases of crime and incivility is concerned, it can be noted that most of the cases often go unreported given that the victims are just reluctant to do so. For instance, during the monitoring period, it can be noted that 27 cases were recorded of which only 11 cases were reported. This amounts to 40.7 % of the cases being reported to the police. 6.0 In as much as fear for crime is concerned, it can be noted that there were mixed feelings among the respondents. As aptly summarised in Tables 7 and 8, it can be seen that on average, about 40 % of the respondents said that they fear to move in certain place at night than during the day. However, the proportion of people who are generally afraid of the unknown shows that there has been a decline in such cases though the general feeling among the respondents is that it is safer during the day than at night. About 2 % of the respondents expressed that they are very worried about sexual assault while on average, the majority of the respondents said that they are not worried about such incidences which they viewed as minor. 6.1 About 8 % of the respondents expressed that they are very worried when they lose their cell phones while about 40 % of the respondents were not very worried to the extent of not being worried at all. 6.2 About 37% of the respondents expressed that they are very worried when their cycles are stolen or vandalised. However, 50 % were indifferent as they suggested that they were not very worried. See chart below. 6.3 The table below shows the results of people who feel intimidated by people who congregate on streets. There has been a decline of people who feel intimidated by people who congregate on the streets from 6 % in 2011 to 1.4 % in 2012. It can also be observed that the number of people who are not intimidated by rowdy behaviour has also increased in 2012. 6.4 The results collected from all the correspondents showed that 66% felt very safe to walk on the streets of Kingston during the day. This can be attributed to the improvement of the security system such as CCTV cameras that have been installed in many parts of the town center. However, the respondents are moderate when it comes to walking in Kingston at night. About 20 % of all the respondents said they were either very safe or unsafe to walk at night. Some of the respondents were indifferent as they did not see any difference. The summary of results is shown in Table 8 and 9. 6.5 The respondents also showed that they felt safe using the train station in Kingston. 46 % of the respondents suggested that the train station was safe while 14 % showed that they were a little bit scared from using the train. This shows that the improvements in personal safety being made by the responsible authorities is playing a pivotal role in allaying personal fears for crime among the majority of the citizens. 6.6 Car parks in Kingston are also seen as safe by various motorists. As shown in table 8, 22% of the people indicated that they fell safe using the car park while 4 % of the respondents felt unsafe to use the car parks. 7 Group differences in perception and behaviour Research has shown that issues such as age, gender, ethnicity as well as disability have an influence on the way people perceive different elements related to personal safety. Takata & Leing (1987) posit to the effect that the degree of fear experienced by an individual can be attributed to aspects related to personal behaviour. However, these are individually based hence they may not be regarded as reflecting the true situation obtaining on the ground. The chart below shows the statistics. 8 Analysis of the findings The results for this survey are consistent with the pattern of previous results. The following observations have been made from the findings of the survey. The concept of gender plays a significant role with regards to the element of personal fear of crime among the people. Women are generally more worried about issues of sexual harassment compared to the males. This can be attributed to the aspect of sexuality given that women often view themselves as targets of sexual harassment by some unscrupulous men. Women are also easily intimidated by the rowdy behaviour of drunkards as well as the people who congregate in streets. Women are more afraid of walking in the dark than men as a result of their sexuality as they fear that they can be sexually harassed. Older people are generally fearful of becoming victims of crime compared to young people. Just like in the previous researches, it has been observed that elder people are sceptical of people who congregate in the streets and they often avoid passing near them. The elder people are not safe to use car parks at night and they often avoid Kingston town center during this time. Age does not matter much especially among young people when it comes to using public transport like buses or trains. The young people are also not afraid of walking in the streets of Kingston and these results reflect the findings of previous studies. Young people in particular are more concerned about damages to their property such as cycles compared to the elder people. The youths value their possessions and they do not want them to be destroyed. However, they are not moved by becoming victims of muggings compared to elder people. People who are disabled show great concern about their safety compared to able bodied people. References Gant, R. (2010). Personal safety in Kingston Town Center. A consideration of trends May 2007- February 2010. Kingston Upon Thames. Kingston University. Grey, F, Jackson, J. & Farall, (2008). Reassessing fear in England and Wales: preliminary findings from the experience and expression project on fear, confidence and policing. London. Herrick, C. (2010). ‘Lost in the world ensuring student learning in the threatened geography field trip. Area 42 182-196. Home office (2008). A new partnership 2008-2011. London. Home Office. Jackson, J. (2006a). ‘Introducing fear of crime to risk research.’ Risk analysis 26 253-264. Killias, M & Cleric, C (2000). ‘Different measures of vulnerability in their relation to different dimensions of fear of crime.’ British Journal of criminology,40, 437-450. Lazel, M. (2009). Fixed CCTV locations. Oc, T. & Tiesdale, S. (1987). Safer city centers. London. Paul Chapman Publishing. Schafer, J.A. Hueber, B.M. & Buynum, J.M. (2006). ‘Fear of crime and criminal victimisation: gender based contrasts.’ Journal of criminal justice, 34, 285-301. Takata, S.R. & Leiting, W, (1987). ‘Learning by doing: The teaching of sociological research methods.’ Teaching sociology.15 144- 150. Walker, A., Flatly, J. & Mood, D. (eds). (2009). Crime in England and Wale 2008/9. Volume 1, London. ESDS. Appendices Table 1 Respondent's age group Valid Percent Valid Under 25 52.0 25 to 39 30.0 40 to 59 10.0 60 and over 8.0 Total 100.0 Respondent has a disability Valid Percent Valid Yes 2.0 No 98.0 Total 100.0 Lives in Kingston upon Thames Valid Percent Valid Yes 46.0 No 54.0 Total 100.0 Respondent is in full-time education Valid Percent Valid Yes 46.0 No 54.0 Total 100.0 Respondent is in full-time education Valid Percent Valid Yes 22.0 No 8.0 Total 100.0 Main purpose of today's journey Valid Percent Valid Visit bank, building society or PO 6.0 Shopping 24.0 Work 18.0 Leisure 4.0 Education 46.0 Other 2.0 Total 100.0 Aware of Kingston Town centre CCTV Valid Percent Valid Yes 58.0 No 24.0 Unsure 18.0 Total 100.0 Table 3 Victim of car stolen Valid Percent Valid No 100.0 Victim of broken into car Valid Percent Valid No 100.0 Victim of vandalise car Valid Percent Valid No 100.0 Victim of stolen cycle Valid Percent Valid No 100.0 Victim of part stolen cycle Valid Percent Valid No 100.0 Victim of vandalise cycle Valid Percent Valid No 100.0 Table 5 Mugged in the street Valid Percent Valid Very worried 6.0 Quite worried 14.0 Not very worried 50.0 Not at all worried 30.0 Total 100.0 Assaulted in the street Valid Percent Valid Very worried 2.0 Quite worried 6.0 Not very worried 62.0 Not at all worried 30.0 Total 100.0 Threatened or harassed by strangers Valid Percent Valid Very worried 2.0 Quite worried 18.0 Not very worried 42.0 Not at all worried 38.0 Total 100.0 Harassed or threatened because of race, disability or sexual orientation Valid Percent Valid Very worried 8.0 Quite worried 16.0 Not very worried 40.0 Not at all worried 36.0 Total 100.0 Sexually assaulted or harassed Valid Percent Valid Very worried 2.0 Quite worried 6.0 Not very worried 40.0 Not at all worried 52.0 Total 100.0 Troubled by groups congregating Valid Percent Valid Very worried 2.0 Quite worried 18.0 Not very worried 50.0 Not at all worried 30.0 Total 100.0 Victim of groups Valid Percent Valid Yes 4.0 No 96.0 Total 100.0 Victim of rowdiness Valid Percent Valid No 100.0 Victim of drunken behaviour Valid Percent Valid No 100.0 Victim of pickpocketing Valid Percent Valid No 100.0 Theft of mobile phone if owned Valid Percent Valid Very worried 8.0 Quite worried 20.0 Not very worried 40.0 Not at all worried 32.0 Total 100.0 Table 6 Mugged in the street Valid Percent Valid Very worried 6.0 Quite worried 14.0 Not very worried 50.0 Not at all worried 30.0 Total 100.0 Assaulted in the street Valid Percent Valid Very worried 2.0 Quite worried 6.0 Not very worried 62.0 Not at all worried 30.0 Total 100.0 Threatened or harassed by strangers Valid Percent Valid Very worried 2.0 Quite worried 18.0 Not very worried 42.0 Not at all worried 38.0 Total 100.0 Harassed or threatened because of race, disability or sexual orientation Valid Percent Valid Very worried 8.0 Quite worried 16.0 Not very worried 40.0 Not at all worried 36.0 Total 100.0 Sexually assaulted or harassed Valid Percent Valid Very worried 2.0 Quite worried 6.0 Not very worried 40.0 Not at all worried 52.0 Total 100.0 Troubled by groups congregating Valid Percent Valid Very worried 2.0 Quite worried 18.0 Not very worried 50.0 Not at all worried 30.0 Total 100.0 Victim of groups Valid Percent Valid Yes 4.0 No 96.0 Total 100.0 Victim of rowdiness Valid Percent Valid No 100.0 Victim of drunken behaviour Valid Percent Valid No 100.0 Victim of pickpocketing Valid Percent Valid No 100.0 Theft of mobile phone if owned Valid Percent Valid Very worried 8.0 Quite worried 20.0 Not very worried 40.0 Not at all worried 32.0 Total 100.0 Table 8 Avoid Kinsgton Town Centre on weekday during daylight Valid Percent Valid Always 4.0 Sometimes 8.0 Rarely 22.0 Never 66.0 Total 100.0 Avoid Kinsgton Town Centre on weekday after dark Valid Percent Valid Always 16.0 Sometimes 22.0 Rarely 22.0 Never 26.0 Never use 14.0 Total 100.0 Avoid Kinsgton Town Centre on weekend during daylight Valid Percent Valid Always 4.0 Sometimes 6.0 Rarely 14.0 Never 66.0 Never use 10.0 Total 100.0 Avoid Kinsgton Town Centre on weekend after dark Valid Percent Valid Always 20.0 Sometimes 20.0 Rarely 20.0 Never 20.0 Never use 20.0 Total 100.0 Felt safe walking on streets Valid Percent Valid Very 36.0 Fairly 58.0 A little unsafe 6.0 Total 100.0 Felt safe using train station Valid Percent Valid Very 46.0 Fairly 40.0 A little unsafe 14.0 Total 100.0 Felt safe using bus station Valid Percent Valid Very 32.0 Fairly 28.0 A little unsafe 18.0 Very unsafe 2.0 Didn't use / didn't do 20.0 Total 100.0 Felt safe using bus stop Valid Percent Valid Very 32.0 Fairly 28.0 A little unsafe 18.0 Very unsafe 2.0 Didn't use / didn't do 20.0 Total 100.0 Felt safe using car park Valid Percent Valid Very 22.0 Fairly 36.0 A little unsafe 16.0 Very unsafe 4.0 Didn't use / didn't do 22.0 Total 100.0 Read More
Cite this document
  • APA
  • MLA
  • CHICAGO
(“Personal Safety in Kensington Essay Example | Topics and Well Written Essays - 2000 words”, n.d.)
Retrieved from https://studentshare.org/geography/1436401-re-write
(Personal Safety in Kensington Essay Example | Topics and Well Written Essays - 2000 Words)
https://studentshare.org/geography/1436401-re-write.
“Personal Safety in Kensington Essay Example | Topics and Well Written Essays - 2000 Words”, n.d. https://studentshare.org/geography/1436401-re-write.
  • Cited: 0 times
sponsored ads
We use cookies to create the best experience for you. Keep on browsing if you are OK with that, or find out how to manage cookies.
Contact Us