StudentShare
Contact Us
Sign In / Sign Up for FREE
Search
Go to advanced search...
Free

Testing the Existence of Risk Premium in Foreign Exchange Markets: Sterling Pound-Swedish Krona - Assignment Example

Cite this document
Summary
This paper presents a report of an empirical study that formulated, estimated, and explained models of log forward and spot exchange rates with permanent and ephemeral dynamics. Our study objective was, in summary, to better our understanding regarding some puzzling…
Download full paper File format: .doc, available for editing
GRAB THE BEST PAPER91.3% of users find it useful
Testing the Existence of Risk Premium in Foreign Exchange Markets: Sterling Pound-Swedish Krona
Read Text Preview

Extract of sample "Testing the Existence of Risk Premium in Foreign Exchange Markets: Sterling Pound-Swedish Krona"

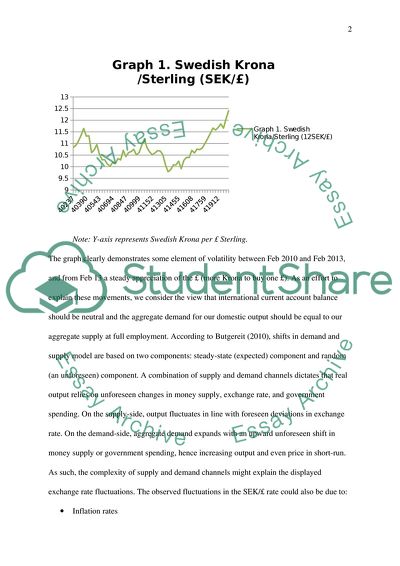
Testing the existence of Risk Premium in Foreign Exchange Markets: Sterling Pound-Swedish Krona Introduction This paper presents a report of an empirical study that formulated, estimated, and explained models of log forward and spot exchange rates with permanent and ephemeral dynamics. Our study objective was, in summary, to better our understanding regarding some puzzling characteristics of foreign exchange market using sterling pound and Swedish currency. The study was conducted through step-by-step questions as follows: i. Question (a) After collecting relevant data regarding the foreign exchange market of choice, we produced a graph of Swedish Krona/£Sterling as displayed in graph 1. Note: Y-axis represents Swedish Krona per £ Sterling. The graph clearly demonstrates some element of volatility between Feb 2010 and Feb 2013, and from Feb 13 a steady appreciation of the £ (more Krona to buy one £). As an effort to explain these movements, we consider the view that international current account balance should be neutral and the aggregate demand for our domestic output should be equal to our aggregate supply at full employment. According to Butgereit (2010), shifts in demand and supply model are based on two components: steady-state (expected) component and random (an unforeseen) component. A combination of supply and demand channels dictates that real output relies on unforeseen changes in money supply, exchange rate, and government spending. On the supply-side, output fluctuates in line with foreseen deviations in exchange rate. On the demand-side, aggregate demand expands with an upward unforeseen shift in money supply or government spending, hence increasing output and even price in short-run. As such, the complexity of supply and demand channels might explain the displayed exchange rate fluctuations. The observed fluctuations in the SEK/£ rate could also be due to: Inflation rates If UK`s inflation is relatively smaller than in Sweden, then exports of UK will be a bit competitive and so the demand for Sterling Pound will increase in order to purchase UK goods. Again, Swedish goods will become less competitive. The Brits will now purchase less imports. Thus, nations with smaller inflation rates appear to have a currency appreciation. Interest Rates If the interest rate in UK increases relative to Sweden, people will find it more profitable to deposit cash in UK. That is, you will obtain better returns from using UK banks to save. Thus, the demand for Sterling pound definitely goes up.  Speculation When speculators trust that demand for sterling will increase in the times to come, they will need more now in order to make profit in future. Therefore, volatility in exchange rate cannot always replicate economic basics, but are frequently driven by the feelings and opinions in financial markets. Relative strength of Swedish Krona. In 2010 and 2012, sterling pound`s value rose alongside the value of Swedish Krona because markets were bothered about other major economies – America and EU. Thus, despite low growth and low interest rates in Sweden, the Krona kept appreciating Government Debt. The value of Swedish and UK government debt might sway exchange rate under some circumstances. When the markets are worried that the governments might default on their own debt, investors are expected to sell their bonds hence causing a decrease in exchange rate value. ii. Question (b). Under this question, we produced a monthly forward discount graph (st - ft) alongside the relevant comments as displayed below: The price of spot exchange rate is ordinarily contrasted with forward exchange rate. From graph 2 we can see that spot rate differ from the forward rate. The spot price is the currency price that is cited for instant payment settlement. The difference between this spot price and Forward price results in forward discount or premium. With regard to currency derivatives, the country must create the closing contract in which she sells the same amount of currency in her foreign exchange so as to leave the forward contract. This then creates the foundation of valuing the forward contract and comprehending the deviation, profits or losses. One theory that also explains this deviation is Interest Parity Theorem, which describes the connection between interest rates and Forward exchange rates. As pronounced by the Interest Parity Theorem, the market creates Forward rate in line with the spot rate so as to neutralize the interest rate disparity between Sterling Pound and Swedish Krona. iii. Question (c) In this section, we provided a summary statistics table with all the variables in our study as shown below: Date Ft Ft3 St ft ft3 st st -1 – ft -1 st -3 – ft3 - 3 st – ft-1 st – ft3- 3 28-Feb-10 1.7221 1.6215 10.8254 0.210078 0.209917 1.034444 0.824366 0.824527 0.824366 0.824527 31-Mar-10 1.7165 1.6159 10.9135 0.208576 0.208414 1.037964 0.829288 0.82955 0.819288 0.82955 30-Apr-10 1.7311 1.6308 11.0984 0.212481 0.214791 1.04526 0.830469 0.830469 0.820469 0.830469 31-May-10 1.546 1.5462 11.3442 0.189209 0.189266 1.054774 0.865565 0.865508 0.85018 0.832259 30-Jun-10 1.5962 1.5962 11.6438 0.203087 0.203087 1.066095 0.863008 0.863008 0.851472 0.840339 31-Jul-10 1.6659 1.6655 11.3189 0.221649 0.221545 1.053804 0.832155 0.832259 0.820222 0.801654 31-Aug-10 1.6364 1.6358 11.3258 0.213889 0.21373 1.054069 0.84018 0.840339 0.83797 0.800453 30-Sep-10 1.6752 1.6745 10.6057 0.224067 0.223885 1.025539 0.801472 0.801654 0.794631 0.820332 31-Oct-10 1.6985 1.6976 10.7223 0.230066 0.229835 1.030288 0.800222 0.800453 0.795688 0.775896 30-Nov-10 1.657 1.6564 10.9521 0.219323 0.219165 1.039497 0.820174 0.820332 0.813971 0.77418 31-Dec-10 1.6652 1.6644 10.525 0.221466 0.221258 1.022222 0.800756 0.800964 0.774095 0.754951 31-Jan-11 1.7013 1.7004 10.3001 0.230781 0.230551 1.012841 0.78206 0.78229 0.775036 0.766012 28-Feb-11 1.7261 1.7249 10.2958 0.230781 0.236764 1.01266 0.781879 0.775896 0.784513 0.774276 31-Mar-11 1.7025 1.701 10.1131 0.231087 0.230704 1.004884 0.773797 0.77418 0.774095 0.77437 30-Apr-11 1.7641 1.7628 10.0266 0.246523 0.246203 1.001154 0.754631 0.754951 0.775036 0.775312 31-May-11 1.7456 1.7443 10.1773 0.241945 0.241621 1.007633 0.765688 0.766012 0.784513 0.81019 30-Jun-11 1.705 1.7038 10.132 0.231724 0.231419 1.005695 0.773971 0.774276 0.784617 0.784891 31-Jul-11 1.7411 1.74 10.3495 0.240824 0.240549 1.014919 0.774095 0.77437 0.802146 0.80238 31-Aug-11 1.7277 1.7266 10.2921 0.237468 0.237192 1.012504 0.775036 0.775312 0.811215 0.811453 30-Sep-11 1.7575 1.6566 10.7006 0.244895 0.219218 1.029408 0.784513 0.81019 0.806533 0.806766 31-Oct-11 1.7137 1.7125 10.4357 0.233935 0.233631 1.018522 0.7846172 0.784891 0.791662 0.791867 30-Nov-11 1.6724 1.6715 10.6044 0.22334 0.223106 1.025486 0.802146 0.80238 0.795648 0.795802 31-Dec-11 1.6457 1.6448 10.6553 0.216351 0.216113 1.027566 0.811215 0.811453 0.801727 0.812272 31-Jan-12 1.6777 1.6768 10.746 0.224714 0.224481 1.031247 0.806533 0.806766 0.834267 0.804948 29-Feb-12 1.6974 1.6966 10.5062 0.229784 0.229579 1.021446 0.791662 0.791867 0.830469 0.7946 31-Mar-12 1.6978 1.6972 10.6056 0.229887 0.229733 1.025535 0.795648 0.795802 0.865565 0.790681 30-Apr-12 1.7236 1.723 10.9185 0.236436 0.236285 1.038163 0.801727 0.801878 0.863008 0.795859 31-May-12 1.639 1.6386 11.1904 0.214579 0.214473 1.048846 0.834267 0.834373 0.86468 0.797314 30-Jun-12 1.6685 1.6682 10.8273 0.222326 0.222248 1.03452 0.830469 0.812272 0.795757 0.787591 31-Jul-12 1.667 1.667 10.6386 0.221936 0.221936 1.026884 0.865565 0.804948 0.781837 0.777266 31-Aug-12 1.6881 1.6878 10.5177 0.227398 0.227321 1.021921 0.863008 0.7946 0.787997 0.781686 30-Sep-12 1.7148 1.7145 10.5881 0.234213 0.234137 1.024818 0.832155 0.790681 0.777266 0.785579 31-Oct-12 1.7109 1.7105 10.6901 0.233225 0.233123 1.028982 0.795757 0.795859 0.781552 0.784269 30-Nov-12 1.7028 1.7024 10.6752 0.231164 0.231062 1.028376 0.781837 0.797314 0.785444 0.795121 31-Dec-12 1.7167 1.7164 10.5247 0.234213 0.234619 1.02221 0.787997 0.787591 0.784137 0.801738 31-Jan-13 1.6854 1.6849 10.0888 0.226703 0.226574 1.00384 0.777266 0.777266 0.773971 0.787942 28-Feb-13 1.6177 1.6172 9.7825 0.208898 0.208764 0.99045 0.781552 0.781686 0.774095 0.795153 31-Mar-13 1.6179 1.6174 9.8718 0.208952 0.208817 0.994396 0.785444 0.785579 0.775036 0.785579 30-Apr-13 1.6561 1.6556 10.0745 0.219087 0.218955 1.003224 0.784137 0.784269 0.784513 0.784269 31-May-13 1.6158 1.6153 10.078 0.208388 0.208253 1.003374 0.773971 0.795121 0.781837 0.795121 30-Jun-13 1.6164 1.6158 10.2359 0.208549 0.208388 1.010126 0.774095 0.801738 0.784848 0.801738 31-Jul-13 1.6161 1.6155 9.914 0.208468 0.208307 0.996249 0.775036 0.787942 0.789573 0.787942 31-Aug-13 1.6468 1.6461 10.2709 0.216641 0.216456 1.011609 0.784513 0.795153 0.781316 0.795153 30-Sep-13 1.719 1.7184 10.4019 0.235276 0.235124 1.017113 0.781837 0.781989 0.790368 0.781989 31-Oct-13 1.7064 1.78056 10.3975 0.232081 0.250557 1.016929 0.784848 0.766372 0.781481 0.766372 30-Nov-13 1.738 1.7372 10.7059 0.24005 0.23985 1.029623 0.789573 0.789773 0.786524 0.789773 31-Dec-13 1.7525 1.7518 10.5919 0.243658 0.243485 1.024974 0.781316 0.781489 0.789222 0.781489 31-Jan-14 1.7432 1.7424 10.7576 0.241347 0.241148 1.031715 0.790368 0.790567 0.801158 0.790567 28-Feb-14 1.7755 1.7747 10.735 0.249321 0.249125 1.030802 0.781481 0.781677 0.800683 0.781677 31-Mar-14 1.767 1.7662 10.8084 0.247237 0.24704 1.033761 0.786524 0.786721 0.783524 0.786721 30-Apr-14 1.7881 1.7873 11.0056 0.252392 0.252197 1.041614 0.789222 0.789417 0.784222 0.789417 31-May-14 1.771 1.7762 11.2041 0.248219 0.249492 1.049377 0.801158 0.799885 0.800158 0.799885 30-Jun-14 1.8093 1.8084 11.4339 0.257511 0.257294 1.058194 0.800683 0.8009 0.80003 0.814588 31-Jul-14 1.7879 1.787 11.6604 0.252343 0.252125 1.066713 0.81437 0.814588 0.81137 0.818212 31-Aug-14 1.7605 1.7596 11.5778 0.245636 0.245414 1.063626 0.81799 0.818212 0.81699 0.832215 30-Sep-14 1.7208 1.7199 11.6874 0.23573 0.235503 1.067718 0.831988 0.832215 0.830988 0.843246 31-Oct-14 1.6996 1.6987 11.8403 0.230347 0.230117 1.073363 0.843016 0.843246 0.840016 0.845158 30-Nov-14 1.6661 1.6653 11.6587 0.221701 0.221492 1.06665 0.844949 0.845158 0.84449 0.861605 31-Dec-14 1.6605 1.6597 12.068 0.220239 0.22003 1.081635 0.861396 0.861605 0.86196 0.88996 31-Jan-15 1.6016 1.6009 12.4258 0.204554 0.204364 1.094324 0.88977 0.88996 0.8877 0.87496 Note: st = log(St), ft = log (Ft), ft3 = log(Ft3) and ft -3 iv. Question (d) In this part of the questions, we did various regression analyses – by incorporating a regressor of the lagged forward discount – in order to test whether a risk premium existed on the 1-month horizon. The model was as follows: st – ft-1 = α + β(st -1 – ft -1) + t The regression was done using stata software and the results were as in table 1. Table 1. Summary results of regression analysis: 1-month horizon Similarly, we ran a test to ascertain if a risk premium existed on the 3-month horizon, but this time by incorporating a 3-month forward discount and lagged 3 months as our regressor. The model was as follows: st – ft3-3 = α + β(st -3 – ft3 -3) + t After completing the regression analyses, the results were tabulated in summary as given in table 2. Table 2. Summary results of regression analysis: 3-month horizon i. Question (e): Interpretation of results This section discussed the implications and the meaning of our findings. We evaluated the legitimacy of the UIP (uncovered interest rate parity) condition alongside the CIP (covered interest rate parity) by empirically estimating our values of alpha and beta. If interest parity theorem holds true, stakeholders will be indifferent regarding the interest rates in UK and Sweden irrespective of whether the position was uncovered or covered since returns that is adjusted to exchange rate will still be the same. The prospective exchange rate ought to depreciate by precisely the interest-rate variance. If the interest rate parity (both uncovered and covered) hold, the implication will be that the forward exchange rate is unbiased estimator of the prospective spot rate. Ordinarily, when there are reasonable expectations within exchange markets and that investors are risk neutral, α ought to be equal to zero. The implication, in that case, will be that constant risk premium do not exist, thus, β also ought to be equal to one; an indication of perfect depreciating association according to the uncovered interest rate parity. However, from our results this is not the case. Our α = 0.10183 and β = 0.87286 in the first model (1-month horizon) with α significantly different from zero at the 95% level, and β also significantly different from 1. This is an indication that risk premium is present on 1-month horizon. From R2 we could say that 86.95% of the data fit our model, providing a high degree of explanation. In the 3-month horizon model (Table 2), α = 0.09285 and β = 0.88627 but we cannot reject the hypothesis at the 95% level of significance that the parameters are not significantly different from zero and one respectively. This indicates that a risk premium is not found in a 3-month horizon, or that any risk premium is being offset by some counter acting forces or drivers that happen to be acting in the opposite direction (two explanations of exchange rate determination are interacting together and in opposite directions). The R2 in this second model revealed that 71.55% of the independent variable data explained our dependent variable movements, which is again quite a high percentage. UIP specifies that as interest-rate disparity upsurges, the exchange rate ought to equally depreciate. That is, if Sweden`s interest rate is 1% ahead of UK`s interest rate for say a 12-months sovereign bond, the Swedish Krona is anticipated to depreciate by at least 1% after the twelve months. Interest rate parity aid in balancing exchange rates since this would cause an arbitrage as both UK and Swedish (foreign) investors might not desire to hold assets with lower interest rate except if the currency is anticipated to appreciate. The issue is that uncovered interest rate parity cannot hold well empirically. Actually, past studies have revealed that currencies of higher interest rate appreciate more compared to currencies of lower interest rate. We have known, from Rosenberg (2003) that β changes significantly across sub-time lags in both value and sign with our current results showing that it has estimated positive values. This positive beta may be understood as the perfect depreciating relationship, totally in line with uncovered interest rate parity. This UIP puzzle proclaims that uncovered interest rate parity is at times rejected through empirical evidence for different currencies across dissimilar time-frames. This let-down in UIP might have lured shareholders to seize excess returns in Sweden exchange market through carry trades –returns which are considerable depending on the level of leverage accrued per trade. According to Evans (2011), foreign exchange trading occasioned the interest rate parity philosophy, which links the difference say between UK and Sweden interest rates (Sweden the foreign country in this case) with regard to the difference in future and spot exchange rates. The philosophy demands that domestic interest rate need to be equal to the anticipated change in exchange rates plus foreign interest rate. If stakeholders have rational expectations and are risk-neutral, the prospective exchange rate ought to flawlessly adjust given the existing interest-rate disparity. The significance of allocating portfolio for risk also clarified the association between interest disparities and risk premiums. Once more, an example might clarify the perception. Suppose sterling interest rates increases compared to the interest rates regarding assets that are denominated in Swedish Krona, as it happened in the 2011s. Other variables kept constant, Swedish speculators will opt to hold more sterling assets, and therefore increasing their vulnerability to currency risk. At equilibrium, a larger risk premium on sterling will be needed to compensate the Swedish speculators for their augmented vulnerability. As for our two models the risk applicable for risk premiums arose utterly from the exchange-rate volatility. This understating of risk has been useful in interpreting the sterling’s behaviour since mid-2000s. From that era, risk premiums have not always been linked to the over-all economic risk applicable to the hypothesis of “safe haven” (Evans, 2011, pg. 135). That is, the connection may be from speculative positions responding to interest differentials for given levels of risk premiums. Conclusion In conclusion, the paper has given a report of an empirical study that formulated, estimated, and explained models of log forward and spot exchange rates with permanent and ephemeral dynamics. The study objective was, to recap, to better our understanding regarding some puzzling characteristics of foreign exchange market: risk premium appears to be present between one month forward and spot rates but less obvious in the 3month to spot spread, suggesting that in the short term, more unknown forward factors affecting exchange rates are revealed and more certain in the market, allowing a systematic but small risk premium to be observed in the data, whereas over a longer time horizon, a range of factors including speculation and portfolio uncertainty, may conflate to mask any underlying risk premia, while even under UIP theory, forward interest rate convergence or divergence in spreads may be quite significant between the two currency regimes to also affect the attempt to “discover” any risk premium over 3 month horizons. This study also accords with previous studies that have empirically challenged the UIP theory, instead specifying that elevated interest rate currencies, on the contrary, have appreciated compared to lower or “supressed” interest rate currencies. Word Count: 1,936 Reference List Butgereit, F. 2010. Exchange rate determination puzzle: Long run behavior and short run dynamics. Hamburg: Diplomica-Verl. Evans, M. D. D. 2011. Exchange-Rate Dynamics. Princeton: Princeton University Press. Rosenberg, M. R. 2003. Exchange-rate determination: Models and strategies for exchange rate forecasting. New York: McGraw-Hill. Read More
Cite this document
  • APA
  • MLA
  • CHICAGO
(International finance Essay Example | Topics and Well Written Essays - 2000 words - 3, n.d.)
International finance Essay Example | Topics and Well Written Essays - 2000 words - 3. https://studentshare.org/finance-accounting/1862367-international-finance
(International Finance Essay Example | Topics and Well Written Essays - 2000 Words - 3)
International Finance Essay Example | Topics and Well Written Essays - 2000 Words - 3. https://studentshare.org/finance-accounting/1862367-international-finance.
“International Finance Essay Example | Topics and Well Written Essays - 2000 Words - 3”. https://studentshare.org/finance-accounting/1862367-international-finance.
  • Cited: 0 times
sponsored ads
We use cookies to create the best experience for you. Keep on browsing if you are OK with that, or find out how to manage cookies.
Contact Us