StudentShare
Contact Us
Sign In / Sign Up for FREE
Search
Go to advanced search...
Free

PK Mart - Industry Trends - Case Study Example

Cite this document
Summary
The primary aim of this report is to conduct independent research for a client organization, PK Mart that is a non specialist retailing company employees 80,000 individuals. The company aims to introduce profit sharing scheme for its employee in order to improve its individual…
Download full paper File format: .doc, available for editing
GRAB THE BEST PAPER94.9% of users find it useful
PK Mart - Industry Trends
Read Text Preview

Extract of sample "PK Mart - Industry Trends"

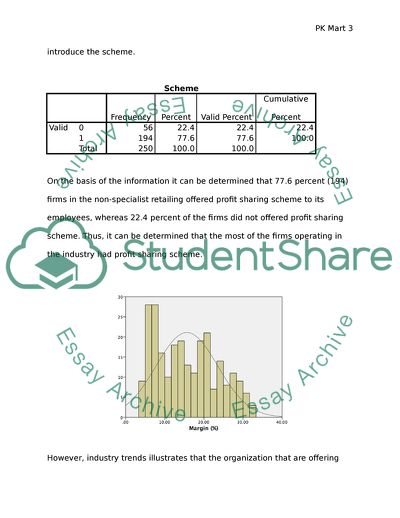
PK Mart PK Mart The primary aim of this report is to conduct independent research for a client organization, PK Mart that is a non specialist retailing company employees 80,000 individuals. The company aims to introduce profit sharing scheme for its employee in order to improve its individual and overall productivity of the organization. Therefore, statistical analysis has been conducted considering decision of PK Mart to introduction profit sharing scheme (commission) for its employees. Thus, quantitative analysis is conducted to determine different aspect of the project and its nature. The main focus of the report is to determine the impacts of the introducing profit sharing scheme on employee satisfaction and organizational commitment. Hence, accounting profit, value added and shareholder wealth are studied as a determinate of company performance that are influenced by the number of controlled variables that is, firm size, market share, age of the firm and team working in the organization. It is essential for the organization to analyze industry trends and patterns prevailing in the industry. Therefore, the data of 250 organizations operating in retailing industry is analyzed to determine patterns and trends of the industry. Descriptive statistics of the collected data is analyzed in order to understand demographic characteristics of the organization operating in the industry with similar profit sharing scheme. The information will be helpful to understand industrial patterns and issues that PK Mart would encounter to introduce the scheme. Scheme Frequency Percent Valid Percent Cumulative Percent Valid 0 56 22.4 22.4 22.4 1 194 77.6 77.6 100.0 Total 250 100.0 100.0 On the basis of the information it can be determined that 77.6 percent (194) firms in the non-specialist retailing offered profit sharing scheme to its employees, whereas 22.4 percent of the firms did not offered profit sharing scheme. Thus, it can be determined that the most of the firms operating in the industry had profit sharing scheme. However, industry trends illustrates that the organization that are offering profit scheme should have certain benchmarks to offer the scheme to its employees. In order to offer profit sharing scheme to its employees the organization is required to have an approximate 15.6% profit margin and 13.79 percent of ROCE. The firms operating in the industry had an average size of 4984, 0.27 percent of market share, 22.12 percent team work and 62.6 ages operating in the industry. Hence, PK Mart should ensure that the company meets the market trends before offering the scheme to its employees. Descriptive Statistics N Minimum Maximum Mean Std. Deviation Margin (%) 250 4.40 32.33 15.6512 7.87806 Size (£m) 250 270.65 13686.62 4984.0620 2537.54056 Team (%) 250 0 77 22.12 15.103 Share (%) 250 .02 .59 .2768 .11736 Age (yrs) 250 34 96 62.60 11.278 ROCE (%) 250 6.90 14.92 13.7910 .77461 Valid N (listwise) 250 Regression Analysis PK Mart should determine if the firm introduces profit sharing scheme will significantly impact performance of firm. Hence, it is important determine the relationship between profit margin and Returns on Capital Employed. Therefore, Regression Analysis is conducted determine the relationship between variables (Srivastava & Sen, 2000). Profit sharing scheme is dependent variables and Profit Margin and Capital Employed are independent variable. In order to test how profit sharing scheme would affect firm’s performance, regression analysis has been conducted with the collected information (Gunst & Mason, 1990). The variables include Profit Margin and Returns on Capital Employed. The overall analysis of the selected firms from the retail firms in the industry is analyzed. The regression model is used to predict the relationship for a small percentage variation in the information that is indicated by the value R Square .007 between profit sharing scheme and profit margin. Relationship between Profit Sharing Scheme and Margin The low value of R Square indicates significant variance in the data that is used for the regression. Model Summary Model R R Square Adjusted R Square Std. Error of the Estimate 1 .085a .007 .003 7.86544 a. Predictors: (Constant), Scheme ANOVAa Model Sum of Squares df Mean Square F Sig. 1 Regression 111.329 1 111.329 1.800 .181b Residual 15342.549 248 61.865 Total 15453.877 249 a. Dependent Variable: Margin (%) b. Predictors: (Constant), Scheme Co-efficientsa Model Unstandardized Coefficients Standardized Coefficients t Sig. B Std. Error Beta 1 (Constant) 16.893 1.051 16.072 .000 Scheme -1.601 1.193 -.085 -1.341 .181 As far as the relationship between scheme and margin is concerned, it can note that the coefficient is a negative number that indicates negative impact on margin. In addition, taking in account the p-value of the independent variable it can be noted that the relationship between scheme and margin is significant because the p-value is lower than 0.05. Hence, it can be determined that if the PK mart introduces profit sharing scheme it would have significant impact on the profit margin of the company. Relationship between Scheme and ROCE Model Summary Model R R Square Adjusted R Square Std. Error of the Estimate 1 .130a .017 .013 .76954 a. Predictors: (Constant), Scheme ANOVAa Model Sum of Squares df Mean Square F Sig. 1 Regression 2.544 1 2.544 4.295 .039b Residual 146.862 248 .592 Total 149.406 249 a. Dependent Variable: ROCE (%) b. Predictors: (Constant), Scheme Coefficientsa Model Unstandardized Coefficients Standardized Coefficients t Sig. B Std. Error Beta 1 (Constant) 13.603 .103 132.284 .000 Scheme .242 .117 .130 2.073 .039 a. Dependent Variable: ROCE (%) The researcher implies regression model to investigate relationship between scheme and ROCE of the firm. The results indicates, coefficient average of 0.242 that is positive number that means that he positive impact of scheme on Returns on Capital Employed (Firm performance).In addition, the p-value of 0.39 show that it is greater than p-value 0.05 that indicates insignificant relation between scheme and ROCE(Stanley & Doucouliagos, 2012). It indicates that the introducing of scheme has no major impacts on the ROCE of the company. The analysis of variance that is presented in the ANOVA table show the overall impact of the variables on dependent variable is significant. It is because 0.39 is less than 0.05 that indicates that the change in the average change in the scheme would impact performance of the firm (Srivastava & Sen, 2000; Stanley & Doucouliagos, 2012). Correlations Scheme ROCE (%) Margin (%) Size (£m) Team (%) Share (%) Age (yrs) Scheme Pearson Correlation 1 .130* -.085 -.023 .064 .064 -.067 Sig. (2-tailed) .039 .181 .715 .316 .314 .291 N 250 250 250 250 250 250 250 ROCE (%) Pearson Correlation .130* 1 .089 .445** .117 .543** .010 Sig. (2-tailed) .039 .162 .000 .065 .000 .880 N 250 250 250 250 250 250 250 Margin (%) Pearson Correlation -.085 .089 1 .571** -.077 .055 .041 Sig. (2-tailed) .181 .162 .000 .225 .385 .520 N 250 250 250 250 250 250 250 Size (£m) Pearson Correlation -.023 .445** .571** 1 -.077 .822** -.022 Sig. (2-tailed) .715 .000 .000 .223 .000 .725 N 250 250 250 250 250 250 250 Team (%) Pearson Correlation .064 .117 -.077 -.077 1 -.042 -.017 Sig. (2-tailed) .316 .065 .225 .223 .512 .792 N 250 250 250 250 250 250 250 Share (%) Pearson Correlation .064 .543** .055 .822** -.042 1 -.035 Sig. (2-tailed) .314 .000 .385 .000 .512 .583 N 250 250 250 250 250 250 250 Age (yrs) Pearson Correlation -.067 .010 .041 -.022 -.017 -.035 1 Sig. (2-tailed) .291 .880 .520 .725 .792 .583 N 250 250 250 250 250 250 250 Multiple Regression Analysis – ROCE between Controlled Variables The multiple regression analysis has been conducted to predict the relationship between four types of controlled variables, age, team, share, scheme and size in order to determine the impacts of profit sharing scheme on the firm. Model Summary Model R R Square Adjusted R Square Std. Error of the Estimate 1 .569a .323 .309 .64373 a. Predictors: (Constant), Age (yrs), Team (%), Share (%), Scheme, Size (£m) The model summary show R-Value of .323 which is considered to low value for the predictability that indicates that 32.3 percent of the variation is observed in the collected data. This shows that the firms in the industry have similar structure to implement profit sharing scheme. ANOVAa Model Sum of Squares df Mean Square F Sig. 1 Regression 48.295 5 9.659 23.309 .000b Residual 101.111 244 .414 Total 149.406 249 a. Dependent Variable: ROCE (%) b. Predictors: (Constant), Age (yrs), Team (%), Share (%), Scheme, Size (£m) Coefficientsa Model Unstandardized Coefficients Standardized Coefficients T Sig. B Std. Error Beta 1 (Constant) 12.352 .274 45.065 .000 Scheme .171 .099 .092 1.727 .085 Team (%) .007 .003 .136 2.566 .011 Size (£m) 1.114E-5 .000 .036 .390 .697 Share (%) 3.390 .617 .514 5.493 .000 Age (yrs) .003 .004 .037 .697 .487 The results provided in the table show that the regression equation of the obtained as follow. ROCE (percentage) = 12.352 +0.171 x scheme +0.007 x team + 1.114 x Size + 3.390 x Share + 0.003 x Age The regression equation indicates that the coefficient of constant, β0 is 12.352 that show that there is a great level of change in the values of dependent variables. The coefficient of slope indicates that there is a positive relation between schemes. It reflects that if the organization implements scheme in operation it will positively impacts ROCE of the firm. The p-value is 0.05; the p value of scheme is 0.085 that shows insignificant relationship with ROCE. In the similar manner, team, size and share show positive relation with ROCE. However, the p value of team and share reflect a significant relation with ROCE but size of the firm has an insignificant relation with ROCE. It shows that the size of the firm would not influence ROCE of the company. However, the team and market share of the company would significantly impact ROCE of the company. Multiple Regression Analysis - Margin and Control Variables Model Summary Model R R Square Adjusted R Square Std. Error of the Estimate 1 .925a .856 .853 3.01914 a. Predictors: (Constant), Age (yrs), Team (%), Share (%), Scheme, Size (£m) ANOVAa Model Sum of Squares Df Mean Square F Sig. 1 Regression 13229.773 5 2645.955 290.280 .000b Residual 2224.105 244 9.115 Total 15453.877 249 a. Dependent Variable: Margin (%) b. Predictors: (Constant), Age (yrs), Team (%), Share (%), Scheme, Size (£m) Coefficientsa Model Unstandardized Coefficients Standardized Coefficients t Sig. B Std. Error Beta 1 (Constant) 12.324 1.285 9.587 .000 Scheme .710 .465 .038 1.529 .128 Team (%) -.003 .013 -.007 -.272 .786 Size (£m) .005 .000 1.626 37.718 .000 Share (%) -86.121 2.895 -1.283 -29.751 .000 Age (yrs) .024 .017 .035 1.432 .153 a. Dependent Variable: Margin (%) The researcher conducted Multiple Regression to determine the impact of controlled variables on the firm’s performance (margin). The multiple regression equation was obtained as follow: Margin (12.324) = 0.710 x scheme -0.003 x team + 0.005 x Size -86.12 x Share + 0.024 x Age The regression equation indicated that the coefficient of constant β0 is 12.324 that reflect that there is high level of change in the values of dependent variables remained unexplained. It can be derived from the equation that scheme (0.710) show positive impacts scheme and margin. It shows that if the scheme is implied it will positively impact the margin of the firm. The p-value 0.128 shows insignificant relation. The size and the age of the firm also have positive impact on margin that shows that age and size of the firm. However, the share and team has negative impact on margin. Age and size has a significant relation with margin, whereas team and size of the firm has negative relation with firm. Hence, it can be determined that the company’s margin would significantly increase if the company schema and size of the company grew. On the other hand, the share and size of the firm has significant relation with margin. This indicates that the profitability of the firm is influenced by the size, share and age of the company. However, the team and scheme of the company does not have any impact on margin of company. List of References Gunst, R. F. & Mason, R. L., 1990. Regression Analysis and its Application: A Data-Oriented Approach. Oxford : CRC Press. Srivastava, S. & Sen, A., 2000. Regression Analysis: Theory, Methods, and Applications. New Jersey: Springer science. Stanley, T. & Doucouliagos, H., 2012. Meta-Regression Analysis in Economics and Business. New York: Routledge. Yan, X. & Su, X., 2009. Linear Regression Analysis: Theory and Computing. London : World Scientific. Read More
Cite this document
  • APA
  • MLA
  • CHICAGO
(Write a report to the Directors of PK Mart Research Paper, n.d.)
Write a report to the Directors of PK Mart Research Paper. https://studentshare.org/finance-accounting/1855297-write-a-report-to-the-directors-of-pk-mart
(Write a Report to the Directors of PK Mart Research Paper)
Write a Report to the Directors of PK Mart Research Paper. https://studentshare.org/finance-accounting/1855297-write-a-report-to-the-directors-of-pk-mart.
“Write a Report to the Directors of PK Mart Research Paper”. https://studentshare.org/finance-accounting/1855297-write-a-report-to-the-directors-of-pk-mart.
  • Cited: 0 times
sponsored ads
We use cookies to create the best experience for you. Keep on browsing if you are OK with that, or find out how to manage cookies.
Contact Us