StudentShare
Contact Us
Sign In / Sign Up for FREE
Search
Go to advanced search...
Free

Financial Ratios, Common Size Income Statements, and Dupont System - Example

Cite this document
Summary
Information from the statements are however crude and further analysis through financial ratios, common size income statements, and the DuPont is necessary for times series analysis of…
Download full paper File format: .doc, available for editing
GRAB THE BEST PAPER97.9% of users find it useful
Financial Ratios, Common Size Income Statements, and Dupont System
Read Text Preview

Extract of sample "Financial Ratios, Common Size Income Statements, and Dupont System"

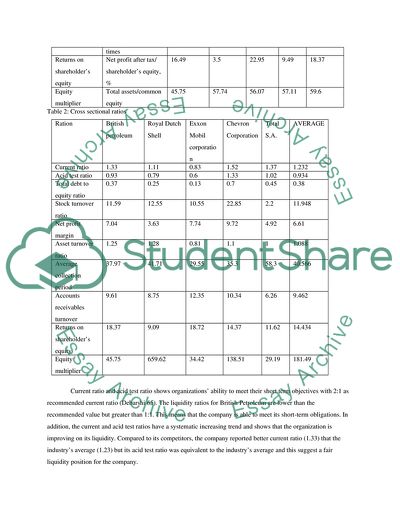
Program Supervisor 27 November Financial ratios, common size income ments, and DuPont system Introduction Financial ments communicate financial information that informs stakeholders’ decisions. Information from the statements are however crude and further analysis through financial ratios, common size income statements, and the DuPont is necessary for times series analysis of an organization’s financial indicators and forecasts of the same. Ratio analysis also facilitates comparative analysis between an organization’s financial indicators and those of its competitors. This paper, using financial ratios, common size income statements, and DuPont analysis, reports on financial position of British Petroleum and compares the company’s performance with its industry’s average. Ratio analysis The following tables summarize selected ratios for British Petroleum for the years ended 2009, 2010, 2011, 2012, and 2013 and for the industry. Table 1: Profitability, liquidity, and efficiency ratios for the period ended 2009, 2010, 2011, 2012, and 2013 Ration Formula 2009 2010 2011 2012 2013 Current ratio Current assets/ Current liabilities 1.14 1.12 1.17 1.44 1.33 Acid test ratio Current assets- stock/(current liabilities- bank overdraft) 0.76 0.81 0.86 1.08 0.93 Total debt to equity ratio Total debts/ shareholders’ equity 0.34 0.48 0.40 0.41 0.37 Stock turnover ratio Cost of goods sold/ average inventory 8.44 11.72 12.15 12.34 11.59 Net profit margin (Net income/ net sales, %) 8.69 -1.3 7.94 3.29 7.04 Asset turnover ratio Net sales/ Average total assets 1.01 1.17 1.33 1.27 1.25 Average collection period 365/ Accounts receivables turnover, days 45.75 41.45 38.62 40.01 37.97 Accounts receivables turnover Sales revenue/average accounts receivables, times 7.98 8.81 9.21 9.12 9.61 Returns on shareholder’s equity Net profit after tax/ shareholder’s equity, % 16.49 3.5 22.95 9.49 18.37 Equity multiplier Total assets/common equity 45.75 57.74 56.07 57.11 59.6 Table 2: Cross sectional ratios Ration British petroleum Royal Dutch Shell Exxon Mobil corporation Chevron Corporation Total S.A. AVERAGE Current ratio 1.33 1.11 0.83 1.52 1.37 1.232 Acid test ratio 0.93 0.79 0.6 1.33 1.02 0.934 Total debt to equity ratio 0.37 0.25 0.13 0.7 0.45 0.38 Stock turnover ratio 11.59 12.55 10.55 22.85 2.2 11.948 Net profit margin 7.04 3.63 7.74 9.72 4.92 6.61 Asset turnover ratio 1.25 1.28 0.81 1.1 1 1.088 Average collection period 37.97 41.71 29.55 35.3 58.3 40.566 Accounts receivables turnover 9.61 8.75 12.35 10.34 6.26 9.462 Returns on shareholder’s equity 18.37 9.09 18.72 14.37 11.62 14.434 Equity multiplier 45.75 659.62 34.42 138.51 29.19 181.49 Current ratio and acid test ratio shows organizations’ ability to meet their short term objectives with 2:1 as recommended current ratio (Debarshi 65). The liquidity ratios for British Petroleum are lower than the recommended value but greater than 1:1. This means that the company is able to meet its short-term obligations. In addition, the current and acid test ratios have a systematic increasing trend and shows that the organization is improving on its liquidity. Compared to its competitors, the company reported better current ratio (1.33) that the industry’s average (1.23) but its acid test ratio was equivalent to the industry’s average and this suggest a fair liquidity position for the company. Debt to equity ratio measures leverage and the low values (lower than 1) shows the company’s ability to meet its long term obligations and to remain stable (Williamson, Williamson, Jenkins, Cooke, and Moreton 121). The ratio was also stable between the year ended 2010 and the year ended 2013 and this shows confidence in long-term stability. The ratio, in 2013, was also slightly below the industry’s average and shows the company’s better leverage over its competitors. British petroleum is also efficient in its operations as its stock turnover ratio reported an increasing trend and a final value (11.59 times) that was close to the industry’s average (11.948). Stock turnover ratio and asset turnover ratio also show a level of consistency over the five years and also compare fairly with the industry’s average. Return of shareholder’s equity was however volatile but war higher than the industry’s average in the year 2013. The selected ratios therefore show the company’s fair performance that is consistent with the industry’s performance. Profitability and return on shareholders’ equity are however volatile and calls for management’s attention. Common size income statements The following table shows the common size income statement for British petroleum over the considered accounting periods. Table 3: Common size income statements for British Petroleum for the periods ended 2009 to 2013 Total revenue 239,272.00 297,107.00 375,713.00 375,765.00 379,136.00 Cost of Revenue, Total 79.71095 96.2851 84.5262 89.11367 87.811498 Gross Profit 20.28904343 3.71482328 15.473779 10.886325 12.188502 Selling/General/Admin. Expenses, Total 5.866963121 4.22575032 3.7150697 3.5546152 3.4473118 Research & Development 0.466414792 0.28373616 0.4045641 0.3925325 0.9075899 Depreciation/Amortization 5.059513859 3.75756882 3.0227860 3.3763123 3.5633651 Unusual Expense (Income) 0.975040958 0.59439865 0.5477585 1.6699266 0.5172286 Total Operating Expense 92.0788893 105.146631 92.216399 98.107061 96.246993 Operating Income 7.921110702 -5.1466307 7.7836007 1.8929384 3.7530068 Gain (Loss) on Sale of Assets 0.908171453 2.14838425 1.0997756 1.7822309 3.4591809 Other, Net -0.24407369 -0.048804 -0.2089361 -0.2113023 -0.185685 Net Income Before Taxes 10.50018389 -1.623994 10.174787 4.8250901 7.9710183 Provision for Income Taxes 3.496021265 -0.5052052 3.3586807 1.8309315 1.7046653 Net Income After Taxes 7.004162627 -1.1187889 6.8161069 2.9941585 6.266353 Minority Interest -0.075646127 -0.1329487 -0.1056658 -0.062273 -0.080974 Net Income Before Extra. Items 6.9285165 -1.2517376 6.7104412 2.9318856 6.1853794 Net Income 6.9285165 -1.2517376 6.7104412 2.9318856 6.1853794 Total Adjustments to Net Income -0.000835869 -0.0006732 -0.0005323 -0.0005322 -0.000528 Income Available to Com Excl ExtraOrd 6.927680631 -1.2524107 6.7099088 2.9313533 6.1848519 Income Available to Com Incl ExtraOrd 6.927680631 -1.2524107 6.7099088 2.9313533 6.1848519 Diluted Net Income 6.927680631 -1.2524107 6.7099088 2.93135337 6.1848519 Diluted Weighted Average Shares 7.913876258 6.32294426 5.0933026 5.0983699 5.023572 Diluted EPS Excluding ExtraOrd Items 0.000367782 -6.732E-05 0.0003513 0.0001516 0.0003244 Diluted Normalized EPS 0.000672874 0.00024234 0.0003300 0.0001490 0.0002031 DPS - Common Stock Primary Issue 0.000234043 4.7121E-05 7.4525E-05 8.7821E-05 9.759E-05 The following table compares common size income statements British petroleum with its industry’s average Table 4: Industry common size income statement British ptr Royal Exxon Chevron Total average Total revenue 379,136.00 451,235.00 420,836.00 220,264.00 215,050.03 Cost of Revenue, Total 87.8114 84.5645 74.9151 64.9724 70.0659 382.3 76.47 Gross Profit 12.1885 15.4354 25.0848 35.0275 29.9340 117.7 23.53 Selling/General/Admin. Expenses, Total 3.44731 3.25218 10.9560 4.12277 0.95101 22.73 4.546 Research & Development 0.90758 1.46176 0.46954 0.84489 4.92571 8.63 1.722 Depreciation/Amortization 3.56336 4.76669 4.08282 6.44045 1.18047 20.03 4.006 Unusual Expense (Income) 0.51722 #VALUE! 90.4235 11.0317 12.5076 #VAL #VALU Total Operating Expense 96.2469 94.0452 9.57641 87.4123 89.6273 376.9 75.38 Operating Income 3.75300 5.95476 0.82977 12.5876 10.3726 33.49 6.7 Gain (Loss) on Sale of Assets 3.45918 0.08465 13.7134 0.32234 -0.09143 17.48 3.498 Other, Net -0.18568 -0.21984 5.76542 16.3008 11.5141 33.17 6.634 Net Income Before Taxes 7.97101 7.44445 7.94798 6.49584 6.47017 36.32 7.26 Provision for Income Taxes 1.70466 3.78206 -0.20625 9.80505 5.04393 20.12 4.025 Net Income After Taxes 6.26635 3.66239 7.74173 -0.07899 -0.12870 17.46 3.492 Minority Interest -0.08097 -0.03435 7.74173 9.72605 4.91523 22.26 4.453 Net Income Before Extra. Items 6.18537 3.62804 7.74173 9.72605 4.91523 32.19 6.439 Net Income 6.18537 3.62804 7.74173 9.72605 4.91523 32.19 6.439 Total Adjustments to Net Income -0.00052 3.62804 7.74173 9.72605 4.91523 26.01 5.202 Income Available to Com Excl ExtraOrd 6.18485 3.62804 1.05005 9.72605 4.91523 25.50 5.101 Income Available to Com Incl ExtraOrd 6.18485 3.62804 0.00175 0.87712 1.05628 11.74 2.349 Diluted Net Income 6.18485 1.39470 0.00175 0.00503 0.00216 7.588 1.518 Diluted Weighted Average Shares 5.02357 0.00057 0.00058 0.00493 0.00239 5.032 1.0064 Diluted EPS Excluding ExtraOrd Items 0.00032 0.00056 0 0.00177 0.00138 0.004 0.000 Diluted Normalized EPS 0.00020 0.00039 0 0 0 0.000 0.000 DPS - Common Stock Primary Issue 9.759E-05 0 0 0 0 9.76E-05 1.95E-05 Results from the common size income statement are consistent with ratio analysis results for British Petroleum and identifies significance of operating expenses on the company’s profitability. Operating expenses remain volatile as ratio analysis identify volatility of profitability and this suggests that focus on managing operating income can influence the company’s profitability. Compared to the industry’s average, British petroleum reported higher percentage operating expense in the year ended 2013(96 %) that the industry’s average (75 %) and this supports the need for management’s efficiency on operational activities and costs. DuPont analysis DuPont analysis helps in understanding elements of an organization’s return on investment, with focus on profits, activity, and equity multiplier (Baker and Powel 65). The following table shows the DuPont components for British Petroliam over the five years. Table 5: DuPont analysis for British Petroliam from 2009 to 2013 Year Profit margin Total asset turn over Equity multiplier 2009 8.69 1.01 45.75 2010 -1.3 1.17 57.74 2011 7.94 1.33 56.07 2012 3.29 1.27 57.11 2013 7.04 1.25 59.6 Equity multiplier is therefore the most significant driver of the company’s return on investment because of the consistently high value. Table 6 shows DuPont components for the industry in the year 2013 and shows consistency in significance of equity multiplier across the industry. Table 6: DuPont components for the industry Company Profit margin Total asset turn over Equity multiplier British petroleum 7.04 1.25 59.6 Royal 3.63 1.28 659.62 Exxon 7.74 0.81 34.42 Chevron 9.72 1.1 138.51 Total 4.29 1 29.19 Industry average 6.61 1.088 181.49 Conclusion British petroleum shows fair and consistent rations, except for profitability rations. The ratios are also consistent with industry’s average and common size income statement, in which operations income is a significant element and is significantly high for British petroleum than for the industry. The organization’s management should improve its efficiency in operations management for better and consistent profitability results. Equity multiplier remains the key factor to return on investment for British Petroleum and for the industry. Reference list Baker, Kent and Powel, Gary. Understanding financial management: A practical guide. Hoboken, NJ: John Wiley & Sons, 2009. Print. Debarshi, Bhattacharya. Management accounting, Pearson Education India, New Delhi, 2011. Print. Williamson, Dave, Williamson, David, Jenkins, Wyn, Cooke, Peter, and Moreton, Keith. Strategic management and business analysis. London, UK: Routledge, 2013. Print. Read More
Cite this document
  • APA
  • MLA
  • CHICAGO
(Financial ratios, common size income statements and DuPont system Coursework, n.d.)
Financial ratios, common size income statements and DuPont system Coursework. https://studentshare.org/finance-accounting/1850388-financial-ratios-common-size-income-statements-and-dupont-system
(Financial Ratios, Common Size Income Statements and DuPont System Coursework)
Financial Ratios, Common Size Income Statements and DuPont System Coursework. https://studentshare.org/finance-accounting/1850388-financial-ratios-common-size-income-statements-and-dupont-system.
“Financial Ratios, Common Size Income Statements and DuPont System Coursework”. https://studentshare.org/finance-accounting/1850388-financial-ratios-common-size-income-statements-and-dupont-system.
  • Cited: 0 times

CHECK THESE SAMPLES OF Financial Ratios, Common Size Income Statements, and Dupont System

A Contemporary Study of the Relationship between CEO Duality and Organizational Performance

The conclusion reached in this research work is that financial performance and CEO duality have a negative relationship with each other.... Researchers have devoted a lot of attention to CEO duality and firm performance.... However, for Kuwaiti companies, this area has yet to be explored....
55 Pages (13750 words) Dissertation

The Financial Analysis from 2006 to 2010 of Kellogg

From the income statement of Kellogg, it is understood that the net sales from the year 2006 to 2008 show an increasing trend while the years 2009 and 2010 point out a decreasing movement in net sales as compared to the previous year.... The purpose of this research paper "The financial Analysis from 2006 to 2010 of Kellogg" is to study the stock of Kellogg by analyzing the 5-year financial history of the firm.... he financial statement from 2006 to 2010 contains 5 years, which require to be inspected to recognize the stock activities in Kellogg....
14 Pages (3500 words) Research Paper

Overall Business Analysis of Louis Vitton Mot Hennessy

It is noteworthy that at the height of the financial crisis that hit the global financial system 2007 and 2008, the LVMH's stock price was flying off the charts, hitting its historical peaks over the past ten years of the life of the stock leading to 2012.... The data on LVMH is more comprehensive financially, and it is from the parent firm that we are able to glean insights into the nature of the financials of LVMH, and indirectly Donna Karan, from the financial statements....
7 Pages (1750 words) Case Study

From Jam: Global Continual Development Strategy of Dupont International Management

The functioning of Dupont as a multinational enterprise will be taken into consideration, as also its global operations and distribution system.... This study undertakes an examination of the dupont Company, in order to identify the factors that are responsible for its continued success in the marketplace over several decades.... With globalization and the increased pressures placed upon multinational firms, dupont is also.... However through a plan of strategic alliances and partnerships, dupont appears to be maintaining a competitive advantage in the global marketplace....
72 Pages (18000 words) Essay

Classical and Imputation Taxation System

The paper "Classical and Imputation Taxation system" is a worthy example of an assignment on finance and accounting.... In the classical system of taxation, both the company and the investor are treated as two separate legal entities and are hence required to pay corporation tax.... The paper "Classical and Imputation Taxation system" is a worthy example of an assignment on finance and accounting.... In the classical system of taxation, both the company and the investor are treated as two separate legal entities and are hence required to pay corporation tax....
10 Pages (2500 words) Assignment

How the Club Accounts for its Money

This report will try to analyze the various methods used by the Jazz club to prepare its financial statements.... This report will try to analyze the various methods used by the Jazz club to prepare its financial statements.... This report will try to analyze the Jazz club's various methods to prepare its financial statements.... The report will use the accounting statements such as ratios to analyze the performance critically and also recommend on various stages within the club whether the methods used are viable or not and also point on the weaknesses that the Jazz club should emphasize if they truly wish to continue as a going concern in business....
11 Pages (2750 words) Term Paper

JB Hi-Fi Financial Statement Analysis

The first step is to make up the adjustments to the company's financial reports, that is, the balance sheets, income statements, and cash flow statements.... This paper takes into account, the annual reports and financial statements of JB Hi-Fi to compute the main financial ratios and assess its performance from 2011 to 2015.... The paper "JB Hi-Fi financial Statement Analysis" is a perfect example of a finance and accounting research paper.... financial statement analysis is what many investors look out for in making investment decisions....
12 Pages (3000 words) Research Paper

Financial Analysis to an Adjusted Set of Accounts of JB Hi-Fi Ltd

From the company's financial statements, it can be seen that the company has continued to increase its profits by at least 26 per cent in the fiscal year 2010 as compared to previous years (JB Hi-Fi, 2014).... Some of the areas of interest in its retail franchise as seen on the company's financial statements include Plasma and LCD televisions, digital camera photography, gaming consoles and accessories, gadgets and information technology among others (JB Hi-Fi, 2014)....
11 Pages (2750 words) Research Proposal
sponsored ads
We use cookies to create the best experience for you. Keep on browsing if you are OK with that, or find out how to manage cookies.
Contact Us