StudentShare

Our website is a unique platform where students can share their papers in a matter of giving an example of the work to be done. If you find papers
matching your topic, you may use them only as an example of work. This is 100% legal. You may not submit downloaded papers as your own, that is cheating. Also you
should remember, that this work was alredy submitted once by a student who originally wrote it.
✕
Free
Air Canada Company Analysis - Case Study Example
Summary
During the past 12 years the industry has been in a transitional period after the 9/11 attack on the city of New York created chaos…
- Subject: Finance & Accounting
- Type: Case Study
- Level: High School
- Pages: 4 (1000 words)
- Downloads: 0
- Author: bheaney
Extract of sample "Air Canada Company Analysis"
Introduction The airline industry operates as an oligopoly due to the fact that there are few players participating in the market and high barriers of entry. During the past 12 years the industry has been in a transitional period after the 9/11 attack on the city of New York created chaos for airlines. Firms had to adapt its security measures and protocols to make flying in an airplane a safe experience once again. In 2012 1,035 million people travelled across the world generating global net profits of $7.6 billion (Plunkettresearch). The purpose of this paper is to compare the financial performance of two companies in the airline industry: Air Canada and Delta Airlines.
Company Background: Air Canada
Air Canada is the largest full service airline in the Canadian marketplace. The company serves nearly 35 million passengers each year to more than 175 destinations on five continents (Aircanada). The firm was founded in 1937. Air Canada has a workforce composed of 27,000 people. The organization is a public firm whose stocks are traded in the Toronto Stock Exchange under the symbol “AC-B.TO.” The corporate headquarters of the company is located in Montreal. The president and chief executive officer of Air Canada is Calin Rovinescu. As of November 16, 2013 the common stocks of the company were trading for $6.81 per share (Aircanada). The total fleet of the firm is composed of 163 airplanes.
Company Background: Delta Airlines
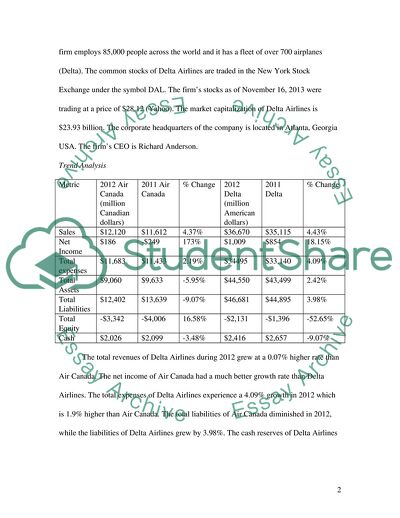
Delta Airlines is a successful company in the airline industry that has been operating since 1928. Today the company serves 160 million travelers each year. The firm employs 85,000 people across the world and it has a fleet of over 700 airplanes (Delta). The common stocks of Delta Airlines are traded in the New York Stock Exchange under the symbol DAL. The firm’s stocks as of November 16, 2013 were trading at a price of $28.12 (Yahoo). The market capitalization of Delta Airlines is $23.93 billion. The corporate headquarters of the company is located in Atlanta, Georgia USA. The firm’s CEO is Richard Anderson.
Trend Analysis
Metric
2012 Air Canada (million Canadian dollars)
2011 Air Canada
% Change
2012 Delta (million American dollars)
2011 Delta
% Change
Sales
$12,120
$11,612
4.37%
$36,670
$35,115
4.43%
Net Income
$186
-$249
173%
$1,009
$854
18.15%
Total expenses
$11,683
$11,433
2.19%
$34495
$33,140
4.09%
Total Assets
$9,060
$9,633
-5.95%
$44,550
$43,499
2.42%
Total Liabilities
$12,402
$13,639
-9.07%
$46,681
$44,895
3.98%
Total Equity
-$3,342
-$4,006
16.58%
-$2,131
-$1,396
-52.65%
Cash
$2,026
$2,099
-3.48%
$2,416
$2,657
-9.07%
The total revenues of Delta Airlines during 2012 grew at a 0.07% higher rate than Air Canada. The net income of Air Canada had a much better growth rate than Delta Airlines. The total expenses of Delta Airlines experience a 4.09% growth in 2012 which is 1.9% higher than Air Canada. The total liabilities of Air Canada diminished in 2012, while the liabilities of Delta Airlines grew by 3.98%. The cash reserves of Delta Airlines diminished at a higher rate than Air Canada. The total assets of Delta grew at a rate of 2.42%, while Air Canada had its total assets balance go down by 5.95%.
Advantages Ratio Analysis
A technique that is going to be used to compare the financial performance of Air Canada and Delta Airlines is ratio analysis. One of the virtues of ratio analysis is that its results can be compared against he results of other companies or against the industry. A database that can be used to retrieved information regarding the industry standard financial ratios is Dun & Bradstreet. Ratio analysis is also useful to compare a firm’s financial performance across time.
Ratio Analysis: Air Canada vs. Delta Airlines
The net margin is a measure of the absolute profitability of a company. In 2012 Delta Airlines had a net margin of 2.75%, while Air Canada had a net margin of 1.53%. The net margin of Delta Airlines is 1.22% better than Air Canada. The industry standard net margin for airlines in 2012 was -1.3% (Dun & Bradstreet). Both companies had better profitability than the industry. The return on assets (ROA) of Delta Airlines in 2012 was 2.26%. Air Canada had a return on assets of 2.05%. Delta’s ROA was 0.21% better than Air Canada. Return on assets shows how effective a company has been at generating profits from its assets. The average ROA of the airline industry for 2012 was -1.3%. Both companies performed better than the industry.
The current ratio shows the ability of a company to pay off its short term debt. The formula to calculate current ratio is current assets divided by current liabilities. In 2012 Delta Airlines and Air Canada had current ratios of 0.62 and 0.94. The industry average current ratio is 1.50. Air Canada is in a better position to pay off its short term debt than Delta Airlines. Delta Airlines must pay close attention to this ratio to ensure the company maintains its liquidity. The debt ratio shows the how prepared a company is to pay off its entire debt. Delta Airlines had a debt ratio in 2012 of 0.95. Air Canada’s debt ratio that year was 0.73. The debt ratio of Delta Airlines is better than Air Canada which implies the company is in a better position to pay off all its debt.
The times interest earned ratio of Delta Airlines in 2012 was 2.68 which is much lower than Air Canada’s times interest earned of 11.81. Air Canada is better positioned to pay of its interest debt. The earnings per share (EPS) of Delta Airlines in 2012 was $1.20. Air Canada had a much lower EPS than Delta Airlines at $0.66. Investors prefer higher EPS results. The debt to equity ratio measures the amount of assets being provided by creditors for each dollar of assets being provided by stockholders (Garrison & Noreen).
Air Canada and Delta Airlines had debt to equity ratios of 3.71 and 32.15 respectively. The operations of Delta Airlines are much more leveraged than Air Canada.
Recommendation
The financial analysis performed on both companies’ shows that Delta Airlines has a much bigger operation than Air Canada. The net margin and return on assets metrics demonstrated that Delta’s profitability is better than Air Canada. Based on the current ratio Air Canada is better positioned to pay off its short term debt, but the debt ratio showed a tendency that Delta Airlines is better positioned to pay off all its debt. The earnings per share of Delta Airlines is $0.54 better than Air Canada. Delta’s debt ratio demonstrated that the company has used debt more than Air Canada. The large debt of Delta has been used over the years to make the corporation grow. In choosing between Delta Airlines and Air Canada I would recommend an investor to purchase Delta Airlines common stocks.
Work Cited Page
Aircanada.com. 2013. “Corporate Profile.” 16 November 2013.
Delta.com. 2013.”About Delta.” 16 November 2013. < http://www.delta.com/content/www/en_US/about-delta.html#>
Dun & Bradstreet. 2013. “Transportation by Air.” 16 November 2013.
Garrison, Ray and Eric Noreen. Managerial Accounting (10th ed.). Boston: McGraw-Hill Irwin. 2003. Print.
Plunkettresearch.com. 13 August 2013. “Airlines, Hotel, & Travel Industry Overview.” 16 November 2013.
Yahoo.com. 2013. “Delta Airlines Inc. (DAL).” 16 November 2013.
Read
More
sponsored ads
Save Your Time for More Important Things
Let us write or edit the case study on your topic
"Air Canada Company Analysis"
with a personal 20% discount.
GRAB THE BEST PAPER
