StudentShare

Our website is a unique platform where students can share their papers in a matter of giving an example of the work to be done. If you find papers
matching your topic, you may use them only as an example of work. This is 100% legal. You may not submit downloaded papers as your own, that is cheating. Also you
should remember, that this work was alredy submitted once by a student who originally wrote it.
✕
Free
Risk-Return Analysis of the Ten Stocks - Essay Example
Summary
retail, oil industry), and the corresponding weights and the number of shares are represented in the following table. It were considered stocks of companies from different industries in…
- Subject: Finance & Accounting
- Type: Essay
- Level: Ph.D.
- Pages: 4 (1000 words)
- Downloads: 0
- Author: erichowell
Extract of sample "Risk-Return Analysis of the Ten Stocks"
Report The portfolio is composed from ten stocks of companies from different areas of service (e.g. retail, oil industry), and the corresponding weights and the number of shares are represented in the following table. It were considered stocks of companies from different industries in order to diversify the risks, which may affect one or another industry
Table no. 1 Initial Investment
Stock
Symbol
Number of shares held
Weight in the portfolio
JB HI-FI LIMITED
JBH
573
10.00%
AUSTRALIA AND NEW ZEALAND BANKING GROUP LIMITED
ANZ
215
10.04%
CUDECO LIMITED
CDU
1493
10.00%
TELSTRA CORPORATION LIMITED
TLS
1289
10.00%
OIL SEARCH LIMITED
OSH
714
10.00%
WOOLWORTHS LIMITED
WOW
176
10.08%
BHP BILLITON LIMITED
BHP
160
10.02%
CROMWELL PROPERTY GROUP
CMW
6944
10.00%
COMMONWEALTH BANK OF AUSTRALIA
CBA
88
9.85%
RETAIL FOOD GROUP LIMITED
RFG
1931
10.00%
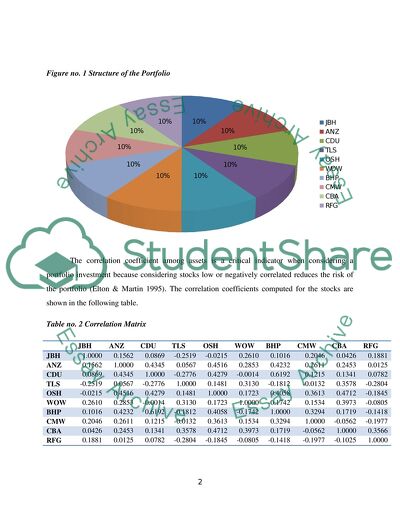
The strategy adopted when it was decided in which stocks to invest the initial capital was an almost equally weighted portfolio (a structure of the portfolio can be seen in figure no. 1). The reason for considering this strategy was the diversification benefit of investing reasonably amount of money in a large number of stocks. Although, it was not the most profitable strategy, it brought a sufficient return to outperform the market. The daily returns for Archie’s portfolio are presented in Exhibit 1.
Figure no. 1 Structure of the Portfolio
The correlation coefficient among assets is a critical indicator when considering a portfolio investment because considering stocks low or negatively correlated reduces the risk of the portfolio (Elton & Martin 1995). The correlation coefficients computed for the stocks are shown in the following table.
Table no. 2 Correlation Matrix
JBH
ANZ
CDU
TLS
OSH
WOW
BHP
CMW
CBA
RFG
JBH
1.0000
0.1562
0.0869
-0.2519
-0.0215
0.2610
0.1016
0.2046
0.0426
0.1881
ANZ
0.1562
1.0000
0.4345
0.0567
0.4516
0.2853
0.4232
0.2611
0.2453
0.0125
CDU
0.0869
0.4345
1.0000
-0.2776
0.4279
-0.0014
0.6192
0.1215
0.1341
0.0782
TLS
-0.2519
0.0567
-0.2776
1.0000
0.1481
0.3130
-0.1812
-0.0132
0.3578
-0.2804
OSH
-0.0215
0.4516
0.4279
0.1481
1.0000
0.1723
0.4058
0.3613
0.4712
-0.1845
WOW
0.2610
0.2853
-0.0014
0.3130
0.1723
1.0000
-0.1742
0.1534
0.3973
-0.0805
BHP
0.1016
0.4232
0.6192
-0.1812
0.4058
-0.1742
1.0000
0.3294
0.1719
-0.1418
CMW
0.2046
0.2611
0.1215
-0.0132
0.3613
0.1534
0.3294
1.0000
-0.0562
-0.1977
CBA
0.0426
0.2453
0.1341
0.3578
0.4712
0.3973
0.1719
-0.0562
1.0000
0.3566
RFG
0.1881
0.0125
0.0782
-0.2804
-0.1845
-0.0805
-0.1418
-0.1977
-0.1025
1.0000
It would be better when considering diversification to have a negative correlation coefficient (which can be seen in the table, but not for all stocks) and this probably will serve for future trading; to study the historical returns and to compute a correlation coefficient before deciding which stocks to include in the portfolio.
When computing the results, it was considered the following equation in order to test the proposition of the CAPM.
Rp-Rf= αi + βi(RM-Rf) (1)
The results obtained for Rp-Rf and RM-Rf can be seen in Exhibit 2. In the following table, there are presented return and risk indicators of market portfolio as well as Archie’s portfolio.
Table no. 3 Comparison between Archie portfolio and the Market portfolio
Market Portfolio
Archie Portfolio
Mean
0.08%
0.42%
Standard deviation
0.54%
4.83%
Sharpe Ratio
0.152
0.088
Although the standard deviation of Archie’s portfolio is higher than the market’s portfolio, is also under normal limits, and the return obtained compensates this level of risk. The fact that the return obtained for Archie’s portfolio beat the market return proves that the efficient market hypothesis, which asserts that the markets are information efficiently and it cannot be obtained above average-market returns on a constant basis (Fabozzi & Drake, 2009), it is not true.
It is better to consider portfolios not very risky because in the literature, Haugen and Hains (1975) documented the low-volatility anomaly i.e. portfolios with lower volatility, generated higher returns. Even more recent studies (Clarke et al., 2006) arrived at the same results in this matter.
Although for choosing the most appropriate weights for the stocks which made the portfolio, a solution would have been the mean - variance analysis, implemented by Markowitz (1952), it is difficult to apply it for ten stocks. If it were considered only 2-3 stocks, it would have been appropriate in order to find the best combination of stocks i.e. with the highest expected return for the level of risk taken.
However, in order to evaluate the results obtained for the portfolio, the following figure provides an overview of the respective returns and standard deviations of the stocks from the portfolio.
Figure no. 2 Risk-return analysis of the ten stocks
Starting from the results obtained in the period of trading, it was applied the single - index model, developed by Sharpe (1964). This model considers the return of a stock as the sum of three components: a constant, an indicator of the firm’s sensitivity to the market’s movements, and finally a random and unpredictable component i.e. error, and the equation for this model can be seen below:
Ri= αi + βiRM + ε (2)
This model states that correlation between stocks exists because each stock is dependent on an underlying systematic factor (Fabozzi & Markowitz, 2002). The rationale behind choosing as benchmark the market portfolio of risky assets is that rational, risk adverse investors will never keep only a risky asset because they can eliminate a part of risk by diversification, and the market portfolio represents the most diversified portfolio (Howells & Bain, 2007).
The parameters of the model are shown in table no. 4.
Table no. 4 Parameters for the model
Intercept
0.0048
Slope
-0.7065
Steyx
0.0498
R squared
0.62%
The capacity of the market return to predict the changes in the portfolio is shown by the coefficient of determination (R squared), which has a small value, of only 0.62%. A comparison between the results obtained for market portfolio and Archie’s portfolio is depicted in the following graph.
The equation estimated through this model is:
RP= 0.0048-0.7065RM +0.0498
Figure no. 3 Comparison between Archie’s portfolio and the Market portfolio
As it can be seen from the graph, returns of Archie’s portfolio have been more volatile, explained by the higher standard deviation of 4.83%, compared with only 0.54% for the index taken as proxy for the market portfolio.
It is also important to consider the systematic and idiosyncratic influences for the portfolio, and the trading activity. A measure for the systematic risk, is the beta computed (slope), which had a negative value of -0.7, suggesting that Archie’s portfolio moves in an opposite direction than the market portfolio (this can also be seen in the returns provided in Exhibit 2).
The idiosyncratic risk (i.e. unsystematic risk) is specific for any individual security and can be eliminated in a large, diversified portfolio (Reilly & Brown, 2002). As it was mentioned at the beginning of this report, this was the reason for choosing ten stocks, and also why the weights in the portfolio were almost equal. The changes in prices over the period of trading determined the decision of buying or selling the shares of the companies considered.
References
Clarke, R., De Silva, H. and Thorley, S. (2006) Minimum-Variance Portfolios in the U.S. Equity Market, The Journal of Portfolio Management, 33(1): 10–24.
Elton, E.J., and Martin J. (1995) Modern Portfolio Theory and Investment Analysis, 5th edn. New York: John Wiley & Sons.
Fabozzi, F.J. and Drake, P. (2009) Capital Markets, Financial Management, and Investment Management, New Jersey: John Wiley & Sons.
Fabozzi, F.J. and Markowitz, H. (2002) The Theory and Practice of Investment Management. New Jersey: John Wiley & Sons.
Haugen, F. and Hains, R. (1975) Risk and The Rate of Return on Financial Assets: Some Old Wine in Financial Bottles, Journal of Financial and Quantitative Analysis, 10(5): 775–784.
Howells, P. and Bain, K. (2007) Financial Markets and Institutions. Harlow: Pearson Education Limited.
Markowitz, H. (1952) Portfolio Selection, Journal of Finance, 7(1): 77–99.
Reilly, F. and Brown, K. (2002) Investment Analysis and Portfolio Management, 7th edn. Boston: South-Western College Pub.
Sharpe, W.F. (1964) Capital Asset Prices: A Theory of Market Equilibrium under Conditions of Risk, Journal of Finance, 19(1): 425-442.
Appendix
Exhibit 1
Daily returns – Archie Portfolio
Date
Wealth
Return
Opening prices { Friday, August 3, 2011}
$50,000.00
Monday, August 06, 2012
$50,368.38
0.0074
Tuesday, August 07, 2012
$50,507.25
0.0028
Wednesday, August 08, 2012
$50,428.60
-0.0016
Thursday, August 09, 2012
$50,898.47
0.0093
Friday, August 10, 2012
$47,820.35
-0.0605
Monday, August 13, 2012
$46,588.90
-0.0258
Tuesday, August 14, 2012
$47,375.89
0.0169
Wednesday, August 15, 2012
$51,006.86
0.0766
Thursday, August 16, 2012
$50,568.41
-0.0086
Friday, August 17, 2012
$51,414.66
0.0167
Monday, August 20, 2012
$51,214.45
-0.0039
Tuesday, August 21, 2012
$45,898.32
-0.1038
Wednesday, August 22, 2012
$52,151.30
0.1362
Thursday, August 23, 2012
$53,091.66
0.0180
Friday, August 24, 2012
$52,903.30
-0.0035
Monday, August 27, 2012
$53,397.75
0.0093
Tuesday, August 28, 2012
$53,839.10
0.0083
Wednesday, August 29, 2012
$50,320.83
-0.0653
Thursday, August 30, 2012
$52,385.26
0.0410
Friday, August 31, 2012
$54,634.41
0.0429
Monday, September 03, 2012
$48,152.81
-0.1186
Tuesday, September 04, 2012
$48,722.80
0.0118
Wednesday, September 05, 2012
$47,984.71
-0.0151
Thursday, September 06, 2012
$48,818.45
0.0174
Friday, September 07, 2012
$48,865.21
0.0010
Monday, September 10, 2012
$52,808.47
0.0807
Tuesday, September 11, 2012
$53,743.79
0.0177
Wednesday, September 12, 2012
$54,465.50
0.0134
Thursday, September 13, 2012
$54,284.14
-0.0033
Friday, September 14, 2012
$54,970.61
0.0126
Exhibit 2
Returns – Rm-Rf and Rp-Rf
Date
Rm-Rf
Rp-Rf
Monday, August 06, 2012
1.17%
0.73%
Tuesday, August 07, 2012
0.42%
0.26%
Wednesday, August 08, 2012
0.49%
-0.17%
Thursday, August 09, 2012
-0.08%
0.92%
Friday, August 10, 2012
-0.64%
-6.06%
Monday, August 13, 2012
0.14%
-2.59%
Tuesday, August 14, 2012
0.17%
1.68%
Wednesday, August 15, 2012
-0.25%
7.65%
Thursday, August 16, 2012
1.06%
-0.87%
Friday, August 17, 2012
0.93%
1.66%
Monday, August 20, 2012
-0.05%
-0.40%
Tuesday, August 21, 2012
0.42%
10.39%
Wednesday, August 22, 2012
-0.18%
13.61%
Thursday, August 23, 2012
0.18%
1.79%
Friday, August 24, 2012
-0.81%
-0.37%
Monday, August 27, 2012
-0.09%
0.92%
Tuesday, August 28, 2012
0.31%
0.82%
Wednesday, August 29, 2012
-0.14%
-6.55%
Thursday, August 30, 2012
-0.95%
4.09%
Friday, August 31, 2012
-0.04%
4.28%
Monday, September 03, 2012
0.28%
11.87%
Tuesday, September 04, 2012
-0.61%
1.17%
Wednesday, September 05, 2012
-0.66%
-1.53%
Thursday, September 06, 2012
0.78%
1.73%
Friday, September 07, 2012
0.39%
0.08%
Monday, September 10, 2012
0.20%
8.06%
Tuesday, September 11, 2012
-0.23%
1.76%
Wednesday, September 12, 2012
0.79%
1.33%
Thursday, September 13, 2012
-0.54%
-0.34%
Friday, September 14, 2012
0.01%
1.25%
Read
More
sponsored ads
Save Your Time for More Important Things
Let us write or edit the essay on your topic
"Risk-Return Analysis of the Ten Stocks"
with a personal 20% discount.
GRAB THE BEST PAPER
