StudentShare
Contact Us
Sign In / Sign Up for FREE
Search
Go to advanced search...
Free

Company Analysis - Toyota Motor Corporations - Case Study Example

Cite this document
Summary
Ratio analysis is undertaken in order to interpret the financial information from the management, creditors and investors view and any other stakeholders. A systematic approach is…
Download full paper File format: .doc, available for editing
GRAB THE BEST PAPER97.9% of users find it useful
Company Analysis - Toyota Motor Corporations
Read Text Preview

Extract of sample "Company Analysis - Toyota Motor Corporations"

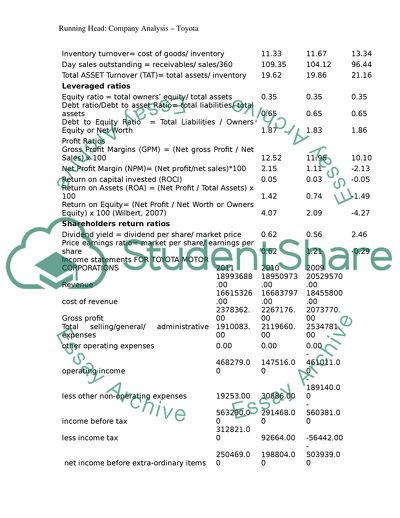
Company analysis- Toyota Motor Corporations Executive Summary This report looks at an analysis of the financial statements for Toyota Motor Corporations. Ratio analysis is undertaken in order to interpret the financial information from the management, creditors and investors view and any other stakeholders. A systematic approach is brought through the calculated ratios where liquidity, Activity, solvency/ leveraged, profitability and shareholder’s returns index are summarized. Industry indicators are also used to give a comparison to this motor corporation. Introduction Toyota Motor Corporation was started in 1933 in Japan. It is a business dealer in automobile as well as finance services and housing deals. The company stands as the leader in the automobile industry followed by general motors and other car manufacturing industries (Jeffrey, 2004). The company has its wings spread all over the world supplying cars. It makes about 40% of all vehicles in the world selling half in its domestic market and the rest international. It has 511 subsidiaries and 217 associate companies by the end of March, 2011. It has been argued that the company sells its merchandise at very high cost leading to abnormal profits (Bill, 2011). The credit rating of Toyota has gone down from AA to AA minus accordingly to the scores rates. RATIO ANALYSIS FOR TOYOTA MOTOR CORPORATIONS Liquidity Ratios Current Ratio = Total Current Assets/ Total Current Liabilities 1.02 1.03 1.08 Acid Test = Total quick assets/ Total current liabilities 0.89 0.90 0.95 (Total quick asset = total current assets minus inventory) 9937715.00 9816617.00 10226262.00 Activity Ratios Inventory turnover= cost of goods/ inventory 11.33 11.67 13.34 Day sales outstanding = receivables/ sales/360 109.35 104.12 96.44 Total ASSET Turnover (TAT)= total assets/ inventory 19.62 19.86 21.16 Leveraged ratios Equity ratio = total owners’ equity/ total assets 0.35 0.35 0.35 Debt ratio/Debt to asset Ratio= total liabilities/ total assets 0.65 0.65 0.65 Debt to Equity Ratio = Total Liabilities / Owners Equity or Net Worth 1.87 1.83 1.86 Profit Ratios Gross Profit Margins (GPM) = (Net gross Profit / Net Sales) x 100 12.52 11.96 10.10 Net Profit Margin (NPM)= (Net profit/net sales)*100 2.15 1.11 -2.13 Return on capital invested (ROCI) 0.05 0.03 -0.05 Return on Assets (ROA) = (Net Profit / Total Assets) x 100 1.42 0.74 -1.49 Return on Equity= (Net Profit / Net Worth or Owners Equity) x 100 (Wilbert, 2007) 4.07 2.09 -4.27 Shareholders return ratios Dividend yield = dividend per share/ market price 0.62 0.56 2.46 Price earnings ratio= market per share/ earnings per share 0.62 1.21 -0.29 Income statements FOR TOYOTA MOTOR CORPORATIONS 2011 2010 2009 Revenue 18993688.00 18950973.00 20529570.00 cost of revenue 16615326.00 16683797.00 18455800.00 Gross profit 2378362.00 2267176.00 2073770.00 Total selling/general/ administrative expenses 1910083.00 2119660.00 2534781.00 other operating expenses 0.00 0.00 0.00 operating income 468279.00 147516.00 -461011.00 less other non-operating expenses 19253.00 30886.00 -189140.00 income before tax 563290.00 291468.00 -560381.00 less income tax 312821.00 92664.00 -56442.00 net income before extra-ordinary items 250469.00 198804.00 -503939.00 MI -57302.00 -34756.00 24278.00 equity in affiliates 215016.00 45408.00 42724.00 net Income 408183.00 209456.00 -436937.00 dividend paid (figures in millions) 156791.00 141120.00 313551.00 number of shares (figure in millions) 3135.91 3135.99 3140.42 dividend per share 50.00 45.00 99.84 earnings per share 130.17 66.79 -139.13 market price 80.54 80.54 40.51 Balance sheet FOR TOYOTA MOTOR CORPORATION 2011 2010 2009 total receivables 5,769,135.00 5,481,099.00 5,499,378.00 Total inventory 1465876 1429363 1383782 Total current assets 11403591 11245980 11610044 Total assets 28761679.00 28387556.00 29284861.00 Total current liabilities 11173520.00 10932580.00 10787814.00 total liabilities 18737812.00 18371123.00 19043857.00 total equity 10023867.00 10016433.00 10241004.00 Total liabilities and equity 28761679.00 28387556.00 29284861.00 Analysis and Interpretation of ratios The liquidity ratio for Toyota Motor Corporation has declined from 2009 to 2011. However the liquidity of this corporation is fairly good because the current ratio is above one and the acid test ratio is close to one for the three consecutive years. Toyota Motors is therefore capable of meeting its short term obligations for the years analysed. These two ratios indicate that the corporations has more liquid assets hence it can meet its financial obligations. The activity ratio indicates a decline over the three years. Inventory turnover indicate how well the management is moving the stock through sales. The reduction in the ratio shows that less stock are held in the company and more sales are made. The day sales ratio on the other hand has risen from 96 days to 109 days. This is an indicator of poor management decision because this shows that the company has to wait for 13 more days to receive its money from its debtors. The day sales figure should be on a reducing trend for good performance The Leverage ratio shows a constant trend over the three years for the debt to assets ratio and slight decline for the debt to equity ratio in 2010. However, this company is highly leveraged. This is because the debts are more than equity shown by the ratio 1:83. This is interpreted as $1 of debt services $0.83 of the equity. The profitability ratio has improved for the three consecutive years. 2009 had negative profits that have tremendously improved in 2010 and 2010. This indicates good performance since the efficiency of resource uses is high for 2010 and 2011. However the corporation needs to improve on the return on assets and return on equity ratios. The current 1.4% and 4.07% of ROA and ROE is too small from an investor’s perspective. Return on shareholders ratios - the dividend yield has improved for the three years. However, the current yield of 0.62 is a good indicator of management performance. An investor’s point of view would be to invest in Toyota Motor since it constantly pays a high dividend per share over the years. The price earnings ratio has improved from a negative figure of -0.58 in 2009 to 1.21 in 2010 then declines to 0.62 in 2011. This shows the amount the investor is willing to pay for one dollar of investment. The improved PE ratio shows that the company investor confidence has increased. In 2009 however, the investors were unwilling to invest in Toyota Motors hence the negative figures in the company’s earnings. Liquidity ratio for Toyota Motor Corporation is relatively good for the three years. The ratio is recommendable when it is at least above one. The significance behind this ratio is that the creditors can place reliance on the company to be paid regularly. The Company has a liquidity of above one (+1) hence it can easily get liquid cash to settle its debts. Cash is not tied up in fixed assets that require further process for disposal. An improvement in the debt to equity or the solvency ratio shows that the company is going into debts. The Company is relying on debts to fund its activities. Nonetheless the ratio should be less than one ( Read More
Cite this document
  • APA
  • MLA
  • CHICAGO
(Financial Analysis: AUTOMOBILE INDUSTRY---TOYOTA Research Paper, n.d.)
Financial Analysis: AUTOMOBILE INDUSTRY---TOYOTA Research Paper. https://studentshare.org/finance-accounting/1772893-financial-analysis-automobile-industry-toyota
(Financial Analysis: AUTOMOBILE INDUSTRY---TOYOTA Research Paper)
Financial Analysis: AUTOMOBILE INDUSTRY---TOYOTA Research Paper. https://studentshare.org/finance-accounting/1772893-financial-analysis-automobile-industry-toyota.
“Financial Analysis: AUTOMOBILE INDUSTRY---TOYOTA Research Paper”. https://studentshare.org/finance-accounting/1772893-financial-analysis-automobile-industry-toyota.
  • Cited: 0 times

CHECK THESE SAMPLES OF Company Analysis - Toyota Motor Corporations

Toyota Company Analysis

inancial analysis ... Toyota Company has been a leading name in vehicle making for quite a lot of decades.... Regardless of the nationalistic movement in the United States to “buy American”, the business has held its own, staying a leading and persistently developing company within the ‘corporate world of transportation....
21 Pages (5250 words) Research Paper

Strategic Management: External Analysis a Toyota Case

Two Major Threats Firstly, availability of close substitutes is seemed to be the major threat to the automobile industry.... To justify this argument, they point that their stakeholders kept shares with the company even when the organization confronted with a difficult business environment as a result of global financial crisis and the 2011 earthquake....
4 Pages (1000 words) Admission/Application Essay

Strategic Development of Toyota

The Japanese automobile giant Toyota is the world's leading car manufacturers which controls major share of world's car market because of their product quality and services offered to the customers.... The US cars were dominated in automobile industry till the initial stages of 1970s....
9 Pages (2250 words) Essay

Marketing Plan for Toyota

are very well informed about the automobile market and the latest cars.... A detailed analysis of the internal strengths and weakness, market scenario, competition analysis is done to identify the gap and accordingly new ways of meeting these gaps through an effective market plan is devised....
18 Pages (4500 words) Essay

Common Assessment: Toyota Motor and Total Company

Given the fact that such factors like management structure, operational, and financial factors exist in both companies, their ways of carrying out these activities can be compared.... It has grown to a big multinational company from where it began and spread to different countries and markets....
7 Pages (1750 words) Research Paper

Management at Toyota Motor Corporation

At the present time, the biggest Toyota competitors are General Motors, the American automobile corporation, For Motors, the American company and Honda Motor Company, the Japanese automobile enterprise.... The paper "Management at Toyota Motor Corporation " discusses that generally speaking, despite the positive prognosis for Toyota Motor company, due to the growth in car sales in the U....
5 Pages (1250 words) Research Paper

Toyota as One of the Biggest Car Manufacturers

The company has also invested heavily in other automobile industry such as Isuzu, Daihatsu, Tesla, Sichuan FAW Toyota, and Fuji Corporation.... The Japanese motor -corporation has its headquarters in Aichi, Japan (Magee 14).... The company is large and complex and it was recently named among the top twenty largest companies globally in terms of....
14 Pages (3500 words) Research Paper

Toyota to Rebuild Its Reputation

"Toyota to Rebuild Its Reputation" paper argues that current consumers are keen on opting for socially committed companies while they take any purchasing decisions.... The recent problems will definitely remain as a black mark on Toyota's image and reputation.... ... ... Toyota Corporation was founded in Japan in 1937....
9 Pages (2250 words) Research Proposal
sponsored ads
We use cookies to create the best experience for you. Keep on browsing if you are OK with that, or find out how to manage cookies.
Contact Us