StudentShare

Our website is a unique platform where students can share their papers in a matter of giving an example of the work to be done. If you find papers
matching your topic, you may use them only as an example of work. This is 100% legal. You may not submit downloaded papers as your own, that is cheating. Also you
should remember, that this work was alredy submitted once by a student who originally wrote it.
✕
Free
The Benefits of Portfolio Diversification - Assignment Example
Summary
The paper "The Benefits of Portfolio Diversification" discusses that Diversifying the portfolio by investing in more stocks can help mitigate the risk that the investor is exposed to. The loss in one asset gets offset by gains in another, reducing the investor's variability in returns…
- Subject: Finance & Accounting
- Type: Assignment
- Level: Undergraduate
- Pages: 5 (1250 words)
- Downloads: 0
- Author: hellen09
Extract of sample "The Benefits of Portfolio Diversification"
1. Given the following information on two shares and the of the economy; of the economy Probability Return on X % Return on Y % Boom0.3
28
45
Normal
0.4
24
38
Recession
0.3
18
9
1 a) Calculate the expected return for each share separately and for a portfolio comprising 60% in X and 40% in Y.
2 Expected return for X:
3 0.3×0.28 + 0.4×0.24 + 0.3×0.18
4 = 0.084 + 0.096 + 0.054
5 = 23.4%
6 Expected Return for Y:
7 0.3×0.45 + 0.4×0.38 + 0.3×0.09
8 = 0.135 + 0.152 + 0.027
9 = 31.4%
10 Expected return for portfolio:
11 0.6×0.234 + 0.4×0.314
12 = 26.6%
13
14
15
b) Calculate the expected risk for each share separately and of the portfolio comprising 60% in X and 40% in Y.
Standard deviation for X:
++
=
= 3.90%
Standard deviation for Y:
=
= 14.95%
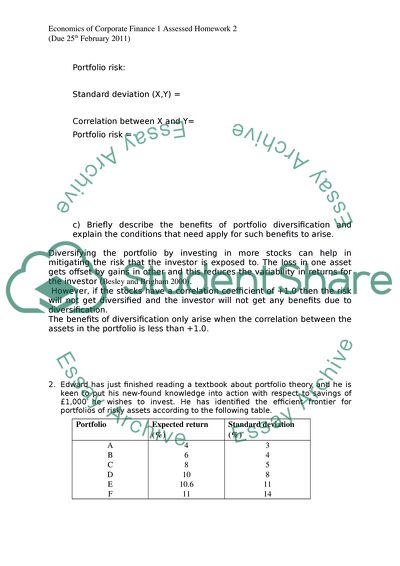
Portfolio risk:
Standard deviation (X,Y) =
Correlation between X and Y=
Portfolio risk =
c) Briefly describe the benefits of portfolio diversification and explain the conditions that need apply for such benefits to arise.
Diversifying the portfolio by investing in more stocks can help in mitigating the risk that the investor is exposed to. The loss in one asset gets offset by gains in other and this reduces the variability in returns for the investor (Besley and Brigham 2000).
However, if the stocks have a correlation coefficient of +1.0 then the risk will not get diversified and the investor will not get any benefits due to diversification.
The benefits of diversification only arise when the correlation between the assets in the portfolio is less than +1.0.
2. Edward has just finished reading a textbook about portfolio theory and he is keen to put his new-found knowledge into action with respect to savings of £1,000 he wishes to invest. He has identified the efficient frontier for portfolios of risky assets according to the following table.
Portfolio
Expected return (%)
Standard deviation (%)
A
4
3
B
6
4
C
8
5
D
10
8
E
10.6
11
F
11
14
He has also estimated that the redemption yield on short-dated Treasury bills is 7 percent and has identified the shape of a typical utility curve given his own attitude towards risk. Points that plots on the utility curve are as follows:
Expected return (%)
Standard deviation (%)
8.8
1
9.0
3
9.5
5
10.2
6
11.2
7
a. Using this information, construct an appropriate diagram (on graph paper) that enables you to identify how Mr Moroley will split his investment between Treasury bills and the market portfolio.
b.
What if his utility function reads as follows
Expected return (%)
Standard deviation (%)
7.5
12.5
8.8
11.7
10.9
11.1
11.8
12.7
3. The table below shows estimates of the risk of two well–known British stocks as at 30th August 2009.
Standard Deviation
R2
Beta
Standard error of Beta
Stock A
18
.43
0.98
.24
Stock B
27
.51
1.97
.29
a. What does R2 represent for Stock A and Stock B?
b. What is the unique variance of Stock B?
c. How confident are you of Stock A and Stock B betas?
d. If the CAPM is correct, what is the expected return on Stock A? Assume a risk–free interest rate of 6 percent and an expected market return of 14 percent.
e. Suppose that next year the market provides a zero return. What return would you expect from Stock A?
a) R2 represents the percentage of stock’s variance that is explained by the market and measures the degree of dispersion about the regression line (Brigham and Ehrhardt 2003). The 0.43 R2 value for stock A indicates that about 43% of the variance in stock A’s returns is explained by the market return. The 0.51 R2 value for stock B indicates that 51% of the variance in stock B’s returns is explained by the market.
c) Beta is estimation and the estimates may go wrong. The standard error of stock A beta is 24% and standard error of stock B beta is 29%.
b) Variance of stock B=
= 0.0729
= 7.29%
d) Expected Return= 6 + (14-6)0.98
= 13.84%
e) Expected return= 6 + (0-6)0.98
= 0.0012%
b) Variance of stock B=
= 0.0729
= 7.29%
References
Besley, S. and Brigham, E.F., 2000. Essentials of managerial finance, 12th ed., South-Western College.
Ehrhardt, M.C. and Brigham, E.F., 2003. Financial Management, 11th ed., South-Western College.
Read
More
sponsored ads
Save Your Time for More Important Things
Let us write or edit the assignment on your topic
"The Benefits of Portfolio Diversification"
with a personal 20% discount.
GRAB THE BEST PAPER
