StudentShare
Contact Us
Sign In / Sign Up for FREE
Search
Go to advanced search...
Free

BP Company - Overall Financial Performance and Dividend Policy - Research Paper Example

Cite this document
Summary
This paper "BP Company - Overall Financial Performance and Dividend Policy" focuses on the fact that BP is one of the world’s leading international oil and gas companies. It operates in more than 80 countries, providing its customers with fuel for transportation, energy for heat and light. …
Download full paper File format: .doc, available for editing
GRAB THE BEST PAPER99% of users find it useful
BP Company - Overall Financial Performance and Dividend Policy
Read Text Preview

Extract of sample "BP Company - Overall Financial Performance and Dividend Policy"

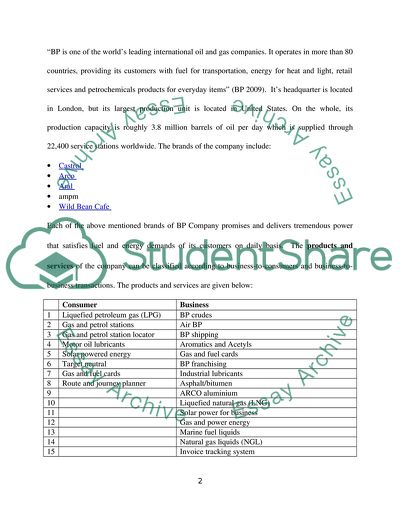
BP Company - Overall Financial Performance and Dividend Policy TABLE OF CONTENTS S. # Title Pg # 1 Introduction 2-4 1-a Products and services 2 1-b Organizational structure 3-4 2 Overall financial performance and dividend policy 4-11 2-a Selected financial data 4-8 Income statement data 5-6 Balance sheet data 6-7 Cash flow data 7-8 Shareholders data 8 2-b Achievements 9 2-c Dividend policy 9-10 Dividends declared and paid 10-11 3 Environment and society 11-17 3-a Past environmental records 11-12 3-b Current Environmental and sustainability measures 12-15 Managing systems and standards 12-13 Safety requirements 13 Technology development 13-14 Decommissioning and remediation 14 Development and community 14 Environmental management 14-15 3-c Impact of these measures on financial performance 15-17 4 Comments on the complexity of annual reports 18-19 5 Limitations 19-20 6 Conclusion 20 7 References 21-23 8 Appendix 24 1. INTRODUCTION: “BP is one of the world’s leading international oil and gas companies. It operates in more than 80 countries, providing its customers with fuel for transportation, energy for heat and light, retail services and petrochemicals products for everyday items” (BP 2009). It’s headquarter is located in London, but its largest production unit is located in United States. On the whole, its production capacity is roughly 3.8 million barrels of oil per day which is supplied through 22,400 service stations worldwide. The brands of the company include: Castrol Arco Aral ampm Wild Bean Cafe Each of the above mentioned brands of BP Company promises and delivers tremendous power that satisfies fuel and energy demands of its customers on daily basis. The products and services of the company can be classified according to business-to-consumers and business-to-business transactions. The products and services are given below: Consumer Business 1 Liquefied petroleum gas (LPG) BP crudes 2 Gas and petrol stations Air BP 3 Gas and petrol station locator BP shipping 4 Motor oil lubricants Aromatics and Acetyls 5 Solar powered energy Gas and fuel cards 6 Target neutral BP franchising 7 Gas and fuel cards Industrial lubricants 8 Route and journey planner Asphalt/bitumen 9 ARCO aluminium 10 Liquefied natural gas (LNG) 11 Solar power for business 12 Gas and power energy 13 Marine fuel liquids 14 Natural gas liquids (NGL) 15 Invoice tracking system Gas and petrol stations Gas and fuel cards Liquefied Petroleum Gas (LPG) Motor oil and lubricants Route and journey planner Solar powered energy Gas and petrol station locator targetneutral ORGANIZATIONAL STRUCTURE: The overall organizational structure of BP Company is divided on the basic of functions performed by its business segments. Several strategic performance units (SPUs) come under each business unit. The aim of the SPUs is to strengthen the stakeholder’s relationships by delivering superior performance, continuously improving its services and taking strong cost controlling measures. The brief classification of these business units and their activities are given below: 1. Exploration and production: the activities which come under exploration and production include upstream activities, midstream activities and marketing and trading activities. On the whole, the tasks covered by this segment include exploration of oil and natural gas, field development to carry out production activities and then processing and transporting the extracted raw materials to their respective departments. Finally the marketing and trading of each brand is carried out separately by relevant departments. 2. Refining and marketing: the activities covered by this segment include refining and purification of petroleum, crude oil, petrochemicals and natural gas. After purification, the supply and transportation of these products is also the core responsibility of this business segment. 3. Other businesses and corporate: “Other businesses and corporate comprises the Alternative Energy business, Shipping, the group’s aluminium asset, Treasury and corporate activities worldwide” (BP Annual reports and accounts 2009). The aim of this separate business unit is to explore low-carbon energy businesses that introduce environment friendly operations. For this purpose, BP Company has explored methods to produce energy through wind, solar, bio-fuels and CCS (carbon capture and storage). The activities carried out by above business segments are integrated and managed through continuous communication. The head of each segment supports co-ordination and corporation by facilitating cross sales and purchases between business units. The main objective of these transactions is to collectively achieve functional expertise and operate at energy frontiers. The contribution of these business segments to the financial performance of the company is analyzed in the next section. 2. FINANCIAL PERFORMANCE AND DIVIDEND POLICY: the overall financial position of the company is stable and strong. The dividends, net assets, shareholders equity, capital acquisitions, sales and cash flow of the company have improved. However, the earnings per share and share price of the company is facing decline. 2-a: SELECTED FINANCIAL DATA INCOME STATEMENT DATA: a. Sales and other operating revenues from continuing operations: Overall the business activities of BP are divided into 3 segments: exploration and production, refining and marketing, and other business and corporate. The sale generated through each segment is presented in the following table: $ million Exploration and production Refining and marketing Other businesses and corporate Adjustments and eliminations[1] Total sales ($ millions) 2009 57,626 213,050 2,843 (34,247) 239,272 2008 86,170 320,039 4,634 (49,700) 361,143 2007 65,740 250,221 3,698 (35,294) 284,365 The adjustments and eliminations are due to the sales among the business segments of BP Company. Therefore, in-house sales transactions do not generate any revenue. Moreover, the expenditure streams for the past three years include purchases, amortization and depreciation, exploration expense, production and manufacturing expense, distribution and administrative expenses, and interest and tax expenses. On the other hand, the income streams include sales, interest income, earning from associates, gain on sales of business and earning from jointly controlled entities. b. Profit for the year: $ million 2009 2008 2007 Profit before income and tax 26,246 35,239 32,352 Interest and tax expense (9,667) (13,573) (11,183) Profit for the year 16,759 21,666 21,169 From the point of view of profits, year 2008 has been the most successful year. However, the profits have declined at the rate of 22% in 2009. The variations in the profits resulted from several factors. In 2007 and 2008, strong marketing campaign, strong cost management, higher realizations and fairly improved oil supply has boosted the profits of the company. On the other hand in 2009, the higher production taxes, weaker marketing tactics, higher depreciation expense and weaker refining margins have shrunk the profitability of the company by 22%. BALANCE SHEET DATA: $ million 2009 2008 2007 Total assets 235,968 228,238 236,076 Total liabilities 133,855 136,129 141,424 Net assets 102,113 92,109 94,652 a. Total assets: the total assets of the company include current and non-current assets. Current assets of the company comprises of short term loans, prepayments and inventories (natural gas, crude oil, refined petroleum, trading inventors and supplies). It also includes cash and cash equivalents, tax and trade receivables. On the other hand, non-current assets comprises of property, plant and equipment, goodwill, intangible assets, deferred tax assets, investments and other receivables. The net assets of the company are declared by subtracting total assets from total liabilities. The net assets of the company have significantly increased to 102,113 million dollars in 2009. The reason for this increase is because of major capital expenditures and acquisitions in “other businesses and corporate” for the purpose of achieving innovative ways of achieving functional expertise. b. Total liabilities: the total liabilities of the company are also divided as current and non-current liabilities. The current liabilities of the company include trade and other payables, finance debts, accruals, provisions, derivative and financial instruments, and tax payable. Furthermore, the non-current liabilities of the company include deferred tax liabilities, pension benefits and post-retirement benefits, accruals and other payables. On the whole, the liabilities of the BP Company have declined because BP has taken active measures to reduce its current loans and the interest expense to be paid on these loans. In 2008 and 2009 the company has paid almost 4% and 1% of its loans respectively. Contradictory to this, the long term loans of the company have increased to 46% in 2009 due to major capital acquisitions in “other businesses and corporate” segment. CASH FLOW DATA: $ million 2009 2008 2007 Cash from operating activities 27,716 38,095 24,709 Cash from investing activities (18,133) (22,767) (14,837) Cash from financing activities (9,551) (10,509) (9,035) cash and cash equivalent (31 Dec 2009) 8,339 8,197 3,562 Cash from operating activities covers the major portion of company’s receipts. This cash is generated by 3 business segments of the company (exploration and production, refining and marketing, and other businesses and corporate). Cash from investing activities includes capital expenditures, investments in associates, acquisitions, investments in jointly controlled entities and proceeds from loan payments and disposal of fixed assets and businesses. So far, revenue is not generated from these activities except for proceeds. Finally, cash from financing activities includes decrease in current debts, dividends paid, issues of shares and repayment of short term loans. The expenditures on financing activities are greater than the revenues received (i.e. from issuance of shares). However the liquidity position of the company is very strong due the availability of idle cash of 8,338 million US dollars. SHAREHOLDER’S DATA: $ million 2009 2008 2007 Shareholder’s equity 101,613 91,303 93,690 Minority interest 500 806 962 Total equity 102,113 92,109 94,652 As it is clearly seen for the above table that the shareholders equity has rose by 10,310 million US dollars. The reason for this is 10% increase in the net assets and 98% increase [(20,262-10,186)/10,186] in the comprehensive income. Earnings per share 2009 2008 2007 Basic earnings per share 88.49 112.59 108.76 Diluted earnings per share 87.54 111.56 107.84 Basic earnings per ordinary share amounts are calculated by dividing the profit for the year attributable to ordinary shareholders by the weighted average number of ordinary shares outstanding during the year. “For the diluted earnings per share calculation, the weighted average number of shares outstanding during the year is adjusted for the number of shares that are potentially issuable in connection with employee share-based payment plans using the treasury stock method” (BP: dividends, 2009, see appendix). 2-b. ACHIEVEMENTS: Apart from the financial results discussed above, BP has achieved operational and functional achievements as well which have a profound impact on the above financial result. These achievements include: Underlying growth of 5% in production is achieved. New resources have been assessed in Jordan, Gulf of Mexico, Indonesia, Egypt and Iraq. The per unit production cost is declined by 12%. The deepest oil well is drilled that has a height of 35,000 feet. Apart from this, 3 more discoveries are made in Angola. Fuels value chains are integrated which has resulted in simplification of operations and lower costs. BP has replaced collectively 129% of its proved reserves from its subsidiaries and equity accounted entities. The gas marketing and trading performance has a major role nn the sales from operating activities. 2-c. DIVIDEND POLICY: Each year since 1917, BP Company has paid its dividends on its ordinary shares. Since 2000 the company has adopted the policy of paying its dividends quarterly i.e. in the months of March, June, September and December. Dividends on ordinary shares are announced in US dollars, however, the directors have authority to declare dividends in any currency but they have to announce an equivalent pound sterling as well. The exchange rates of the equivalent pound sterling are calculated by taking the average of forward exchange rates of five business days in London, prior to the announcement date of dividends. As determined by International financial reporting standard (IFRS) and UK companies Act, dividends will not be paid from other than the profits available for distribution. The dividends of BP preference shares will be paid first and dividends on ordinary shares will be paid later. If any dividend is not claimed within the period of 12 years, it will be cancelled and will revert to the BP Company. In addition to this, directors can pay interim dividends as well but only after obtaining shareholders permission. On the other hand, shareholders can also declare dividends by consensus, provided that it should not exceed the amount recommended by the directors. Furthermore, for the backup plan the Articles of Association determines that the company should secure/save some proportion of profits in the form following backup reserves so that the dividends of the shareholders shall be guaranteed. A general reserve should be maintained each year from the balance of profits, which will provide excess cash for the purpose of carrying out revenue expenditures. Also a special reserve fund form the profits of the BP Company will be maintained each year in order to meet the deficiencies of the dividends of the preference shares. DIVIDENDS DECLARED AND PAID: Since BP is now delisted from Toronto Stock exchange, therefore since 2009 dividends are not paid in Canadian dollars. Now dividends are paid in UK ponds and US dollars only. The company has paid a total of 10,483, 10,342 and 8,106 million US dollars in dividends in years 2009, 2008 and 2007 respectively. However, 2009 dividend per share is 56 cents and 36 pence. Note: Former Amoco Corporation and Atlantic Richfield Company shareholders will not receive dividends or proxy material unless they provide their ordinary shares in exchange. 3. ENVIRONMENT AND SOCIETY: 3-a. PAST ENVIRONMENTAL RECORD: Over the years, BP Company has been continuously criticized for the violation and damage caused to the people and society from their hazardous substances and dangerous operations. Mother Jones magazine has reported BP as “one on the ten worst corporations based on its environmental and human right records”. According to public interest and research group (PIRG), from 1997-1998 BP company was responsible for around 104 oil spills. The safety records of the company highlight some disastrous incidents and explosions resulting into lives loss and serious violations of the environmental and safety standards. Hazardous substance dumping (1993-1995) Sea jam offshore oil rig disaster (1965) Prudhoe bay (2006-2007) Refinery facilities and safety violations (2006-2010) Texas city refinery explosion (2005) North Sea helicopter accident (2009). The above incidents resulted due to the mismanagement, organizational and safety deficiencies, management failures and constant breaching of rules and regulations. As a result, more the 68 people died, over 316 people got injured and heavy civil and criminal penalties were imposed on BP Company. Not only this, the company had to shut down some of its plants like Prudhoe Bay and BP facilities in US and Gulf of Mexico. Considering the nature of industry (i.e. oil and natural gas) such inadequate safety measures will most definitely result into explosions and major oil spills which will have a multiplier effect on the damage caused to the environment and society. Therefore BP Company has incorporated a comprehensive environmental management plan and sustainability standards. If managed effectively, these efforts will serve as roadmap in making BP Company an environmentally responsible organization. 3-b. CURRENT ENVIRONMENTAL PRACTICES: in order to improve its environmental record, BP has adopted a new vision by adding a strap line to its logo which says “BP: beyond petroleum”. The company is working on individual basis and in partnerships to minimize the impact of its operations on the environment and society. For this purpose, the company is looking for technological advancement, ensuring work place safety, reducing emissions of hazardous substances every year and working on new low carbon energy projects to make its operations more responsible. i. Managing systems and standards: A formal process is conducted by BP Company every year in which they identify and evaluate the risks associated with the environmental and society issues. For this purpose BP has renewed its systems and assets, redefined the safety standards and developed records of the on job problems. Moreover, BP has divided its safety standards for every phase of operations, which includes: launching new projects, carrying out day-to-day operations and bringing a project to an end. ii. Safety requirements: BP Company is subject to environmental and common law claims for personal injury and property damage resulting from the hazardous substances and gases released at workplaces, mines and during deepwater drilling. BP aims to minimize this risk by measuring safety in following forms: Personal safety: on job safety is very important secure the intellectual capital. The work place injury rates have reduced by almost 75%. The average injury rate for year 2009, 2008 and 2007 is 10 injuries each year. Process safety: in order to improve the processes, BP regularly conducts inspections of safety-critical equipments and leakages in pipe lines. On average 14 work-related major incidents were reported in 2008 and 2009 but none of those were process related. Transportation safety: for the assessment and management of transportation safety, BP provides in-house training to ensure aviation safety, safe driving and safe shipping. Product safety: BP provides information and safe handling guidance to its product users on container labels and material safety data sheets (MSDSs). By 2009, BP has 88,000 MDSs available in 38 languages. iii. Technology development: The Company has invested in technologies covering all aspects of its business operations. For instance, it has invested in marine life research program to study the impact of its deep water drilling on marine life. It has also introduced advanced drill cutting treatment that provides on job safety to the front line employees. In addition to this, BP also works in partnerships to jointly achieve technological excellence: Together with Princeton University, BP has introduced carbon mitigation initiative to deal with environmental issues of carbon emission. The energy biosciences institute (EBI) and BP are doing research to implement bio-fuel technologies. BP and energy technology institute (ETI) are discovering new methods of producing wind, solar and marine energy. iv. Decommissioning and remediation: BP has appointed remediation specialists to monitor the impact of the company’s operations. The purpose of remediation activities is to reduce the potential environmental liabilities. “Since 2004, remediation management experts have reduced the group’s soil and groundwater contamination liabilities by more than $700 million dollars to $1.7 billion” (BP: 2009) v. Development and community: BP works closely with local authorities, government and community groups to provide its expertise and resources on education and public infrastructure program. Each year the company invests millions of dollars on the education programs in US, UK, Germany and China. In addition to this, the company is working on health issues resulting from unclean water, gas emissions, noise pollution and diseases like HIV/Aids, malaria and tuberculosis. vi. Environmental management: the major sites of BP are certified with international environmental management system standard ISO 4000 which ensures compliance with the minimum environmental regulations. In addition to this, the company has established safety and environmental requirements in its code of conduct for its employees, suppliers, partners and contractors to contribute to a sustainable environment in order to retain the support of shareholder, customers and the communities in which BP operates (BP sustainability review 2009). So far the company has achieved following results: BP’s Green house gas emissions have reduced up to 7.9 million tons (Mte) since 2002. The ozone layer depleting potential (ODP) of the company in 2009 was reduced to 322.9 ODP. The ODP of chloro-fluoro-carbon (CFCs) is 1, for halon the ODP is 12, for hydro-chloro-fluoro-carbons (HCFCs) it is 0.12 and for methyl bromide it is 0.7. Waste management is done through integrated “life-cycle approach” which is used for the purpose of transportation, treatment, reuse, recycling, recovery and final disposal of hazardous waste. For water management BP has developed treatment plants to remove the chemicals, hydrocarbons and solids down to very low levels before the waste water is discharged. In 2009, BP has reduced discharges by 12,000 tones. 3-c. IMPACT OF THESE MEASURES ON FINANCIAL PERFORMANCE: In today’s business world the fundamental rules of business have changed. Company’s financial performance is not only measured on the basis of tangible results like profits, sales, cash flow, expenses, earnings per share, total assets and total liabilities. The environmental crises have increased the ethical obligations of the firms. The non-financial performance of the company has introduced a new dimension of performance measurement. According to this concept, each and every organization must comply with the social, geographical, environmental, ethical and political laws because they play a significant role to maintain an environment in which the firms can operate favourably. Companies operating in high polluting industries have the biggest impact of their environmental measures on the financial profitability and business performance. The International Accounting Standards Board (IASB) requires transparent presentation of environmental practices by through valuation and description of the impact of the risks associated with company’s operations. By now the financial statements do not reflect the social issues directly but companies are now preparing their environment sustainability reports in which they give a clear picture of their waste generation, noise pollution, release of hazardous substances and contribution in social and environmental well being of people. In the current business era, multinational firms and local businesses actively engage themselves to renew their processes and technologies that have a lesser impact on the environment. In addition to this, companies are spending a proportion of their profits for social issues like education, employment, health, building of roads and infrastructure, availability of clean drinking water etc. to prove their concern for the society and people. However, everything has its costs. Similarly these environmental concerns and sustainability measures also have both positive and negative impacts on the financial positioning of the company. Now let’s have a look at the impacts of these measures on the internal and external success and reputation of BP Company. Positive impact: The goodwill of the company will improve over the years as the company has adopted processes that are mutually beneficial for the safety of employees, customers, society and environment. The trust and reputation of the company is badly affected due to the work place accidents, oil spills and explosions. The company will re-build the trust of customers, shareholders and the communities in which it operates by proving its concern for the society. The share prices and resulting earnings per share will increased due to improved performance, operational efficiency and technological advancements. The additional expenditures of fines, penalties and negative publicity will be prevented. Negative impact: The expenses of the company have increased significantly. $ million Environmental expenditures 2009 2008 2007 Operating expenditures 701 755 662 Capital expenditures 70 64 62 Decommissioning provisions 159 307 1,163 Clean-ups 955 1,104 1,033 Remediation provisions 588 270 373 So far, the investing activities on environmental projects did not generate short term revenues. So the profits significantly squeezed which has a negative impact on retained earnings and earning per shares. The primary goal of the organization is to generate profits by achieving functional excellence in daily operations. On the other hand, corporate social responsibility is a secondary thing. The liquidity position of the company will grow weaker if more and more expenditures are incurred on environmental and society issues. Managing these long term sustainability measures require strong commitment over the years. It is relatively easy to define systems, processes and standards but managing and monitoring these operations continuously and in an ongoing manner requires expertise, skills and resources which are “limited/scare”. 4. COMMNETS ON THE COMPLEXITY OF ANNUAL ACCOUNTS: The financial reports help the shareholders to make investment decisions. Therefore, it is extremely important to reflect the transparent and clear reality of the business and the economic world. These reports briefly accumulate the current and past data of overall performance, policies, decisions, profitability, risks and flaws of the company’s operations on the basis of which, future goals are set. Therefore, the accounting reports are accountable to provide a clear picture of the company’s positioning. On the other hand, unambiguous, incomplete and deceitful information will serve as a false roadmap on which the decisions are made. The unavailability of relevant and up to date information will affect all stakeholders. For instance, suppliers will not be able to understand the credibility of the company in terms of regular payment, the opportunity cost of the investors will increase due to the complexity of information, lenders will not get a clear picture of the credit standing of the company, customers will be unaware of the potential harms of the products, government will impose tax on the basis of under/over estimated profits and employee goals will be unrealistic due to the incorrect setting of the future goals . Not only this, the resources of the company will be misused, the capital will be deployed, the investment return will decline and eventually the confidence of the stakeholders will be lost. Undoubtedly, investors today are more informed and educated and they demand more transparent and clear insight about how these figures are derived. It is unrealistic for the investors to study the annual reports of the all major companies of the industry and compare their results. While business results and their reporting are getting more and more complex due to government regulations, legal complications and sophisticated accounting policies. Not surprisingly the calculation of the monetary values of intangible assets, hedge accounting, impairments and differed taxation has made concepts overcomplicated. Not only this, the length of accounting reports almost doubled containing excessive information (Deloitte 2007). In order to improve the transfer and understanding of information, the accounting policies defined by GAAP and IFRS should be redefined. For instance: Narrative reporting should be simplified so that management can explain the strategy, risks, opportunities and challenges of the internal and external environment so that the clarity of the report is improved. The reports should be summarized with technical guide available for further reference to those who want it. Summary information page should be introduced at the beginning of the report that gives a brief overview of the company’s positioning. A brief (1 page) comparative analysis of the monetary values like (profits, share price, sales, assets, cash, liabilities etc) should be given which states an overview of the overall performance of the company in the industry so that the inspection time of investor is saved. 5. LIMITATIONS OF THE REPORT: This report is strictly limited to the reviewed years of 2007, 2008 and 2009. The changes made in the dividend policy and the cancellation of the dividends in year 2010 is not included in this report. The April 2010, deepwater horizon oil spill has increased the environmental liabilities of the company. The clean-up and other damage cost is not included in the report. The additional fines and penalties imposed due to deepwater horizon oil spill have badly affected the expected profit, capital expenditures, cash flow, borrowings and net assets of the company in 2010. 6. CONCLUSION: BP Company is undoubtedly one of the giants of the oil and gas industry. It is providing fuel, energy for heat & light, and petrochemical products to its geographically dispersed customers. The company’s financial positioning is strong stable in the reviewed years of 2009, 2008 and 2007. The liquidity position of the company is very strong and has cash at end of 8,339 million which can be utilized in financing and investing activities. The profits of the company reached its peak in 2008 due to higher realization and strong cost control. Although the profits of the company declined in year 2009, but BP has huge scope to increase its profits by managing its capital resources efficiently. The net assets, shareholders equity and comprehensive income of the company have increased sharply. The total liabilities of the company have also reduced significantly due to payment of short-term loans. However the share prices of the company is declining due to external environment. From the point of view of corporate responsibility, BP has faced several crises due to oil spills, explosions at mines and breaching of the safety laws. However, the company’s new vision of “beyond petroleum” is serving a roadmap to serve responsibly in its communities. The current standards, processes and technologies will help BP to operate at energy frontiers by reducing emissions, protecting environment, ensuring workplace safety and developing the communities. This new vision will hopefully improve the trust and goodwill of the company and will produce mutually beneficial results for stakeholders. 7. REFERENCES: 1. BP, 2009. BP annual reports and accounts 2009.[Online] Available at: < http://www.bp.com/extendedsectiongenericarticle.do?categoryId=9021605&contentId=7040949> [Accessed 5 November 2010] 2. BP, 2008. BP annual reports and accounts 2008.[Online] Available at: < http://www.bp.com/extendedsectiongenericarticle.do?categoryId=9021605&contentId=7040949> [Accessed 5 November 2010] 3. BP, 2007. BP annual reports and accounts 2007.[Online] Available at: http://www.bp.com/extendedsectiongenericarticle.do?categoryId=9021605&contentId=7040949 [Accessed 5 November 2010] 4. BP, 1999-2010. Environment and society.[Online] Available at: http://www.bp.com/sectionbodycopy.do?categoryId=2311&contentId=7060022 [Accessed 4 November 2010] 5. CIMA, 2009. Complexity, relevance and clarity of corporate reporting. [Online] Available at: http://www.iasplus.com/resource/0905cimastudy.pdf [Accessed 9 November 2010] 6. Wikipedia, 2010. BP. [Online] Available at: http://en.wikipedia.org/wiki/BP [Accessed 2 November 2010] 7. U.S securities and exchange, 2006. Speech by SEC commissioner: complexity in financial reporting and disclosure. [Online] Available at: http://www.sec.gov/news/speech/2006/spch060806cag.htm [Accessed 9November 2010] 8. ACCA, 2010. Complexity in financial reporting. [Online] Available at: http://www.accaglobal.com/global_standards/opinion_pieces/Complexity_F_R [Accessed 8 November 2010] 9. IFAC, 2008. Current Perspectives and Directions. [Online] Available at: http://web.ifac.org/publications/ifac-policy-position-papers-reports-and-comment-letters/reports-1 [Accessed 8 November 2010] 10. Financial Reporting Council, 2008. Project to Review the Complexity and Relevance in Corporate Reporting. [Online] Available at: http://www.frc.org.uk/about/complexity_panel/index.cfm [Accessed 8 November 2010] 11. International accounting standard board, 2008. Reducing complexity in reporting financial instruments. [Online] Available at: http://www.iasb.org/NR/rdonlyres/A2534626-8D62-4B42-BE12-E3D14C15AD29/0/DPReducingComplexity_ReportingFinancialInstruments.pdf [Accessed 8 November 2010] 12. MSN: money, 2010. BP ADR each is representing six ord shs: company report. [Online] Available at: http://moneycentral.msn.com/companyreport?symbol=BP [Accessed 4 November 2010] 13. Dividend.com, 2007-2010. Historical divided data for BP PLC (BP). [Online] Available at: http://www.dividend.com/historical/stock.php?symbol=BP [Accessed 4 November 2010] 14. Funding universe.com. The British petroleum Company plc. [Online] Available at: http://www.fundinguniverse.com/company-histories/The-British-Petroleum-Company-plc-Company-History.html [Accessed 4 November 2010] 15. Robert Lea, 2009. How safe is the BP dividend? [Online] Available at: http://www.thisislondon.co.uk/standard-business/article-23653196-how-safe-is-the-bp-dividend.do [Accessed 7 November 2010] 16. Kristen Korosec, 2010. BP’s history of oil spills and accidents: same strategy, different day. [Online] Available at: http://www.bnet.com/blog/clean-energy/bp-8217s-history-of-oil-spills-and-accidents-same-strategy-different-day/1768 [Accessed 4 November 2010] 17. World resources institute, 2000. The financial implications of environmental performance. [Online] Available at: http://pdf.wri.org/pureprofit.pdf [Accessed 8 November 2010] 18. UNCTAD secretariat, 1997. Environmental financial accounting and reporting at corporate level. [Online] Available at: http://www.unctad.org/en/docs/c2isard2.en.pdf [Accessed 9 November 2010] 19. Donald Sutherland, 2002. Europe tightens accounting rules. [Online] Available at: http://www.riskworld.com/news/02q3/nw02a097.htm [Accessed 10 November 2010] 20. Financial Gauges, 2009. BP: Financial analysis through 2008. [Online] Available at: http://www.financial-gauges.com/2009/02/bp-financial-analysis-through-december.html [Accessed 4 November 2010] 21. The business ethics blog, 2010. BP and corporate social responsibility. [Online] Available at: http://businessethicsblog.com/2010/09/01/bp-and-csr [Accessed 7 November 2010] 22. Venus D., 2010. What are earnings per share? [Online] Available at: http://www.wisegeek.com/what-are-earnings-per-share.htm [Accessed 9 November 2010] 23. London South East, 2010. Bp share price (BP.). [Online] Available at: http://www.lse.co.uk/shareprice.asp?shareprice=bp. [Accessed10 November 2010] 24. Vijay P Rao, 2007. Future challenges facing BP: how technology can help. [Online] Available at: http://www.slideshare.net/vijayrao/challenges-bp-faces-today-how-technology-can-help [Accessed7 November 2010] 25. MR Zine, 2010. BP: The Worst Safety and Environmental Record of All Oil Companies Operating in the United States. [Online] available at: http://mrzine.monthlyreview.org/2010/slocum060510.html [Accessed10 November 2010] 8. APPENDIX: Read More
Cite this document
  • APA
  • MLA
  • CHICAGO
(BP Company - Overall Financial Performance and Dividend Policy Research Paper - 1, n.d.)
BP Company - Overall Financial Performance and Dividend Policy Research Paper - 1. Retrieved from https://studentshare.org/finance-accounting/1744150-accounting
(BP Company - Overall Financial Performance and Dividend Policy Research Paper - 1)
BP Company - Overall Financial Performance and Dividend Policy Research Paper - 1. https://studentshare.org/finance-accounting/1744150-accounting.
“BP Company - Overall Financial Performance and Dividend Policy Research Paper - 1”, n.d. https://studentshare.org/finance-accounting/1744150-accounting.
  • Cited: 0 times

CHECK THESE SAMPLES OF BP Company - Overall Financial Performance and Dividend Policy

Risk Management and Insurance

hellip; The US based company I wish to examine in terms of its' performance in the current marketplace is Great American.... (Yahoo Finance 2013) Professional liability insurance is a specialized form of liability insurance which indemnifies a professional who causes a loss to his or her client due to the negligent performance of their duties or which is not up to the professional standards stipulated by the professional association regulating the particular professional....
6 Pages (1500 words) Assignment

Large UK Health and Beauty Retailing Company

22 over two years (Alliance UniChem Key financial Data, 2005); and J Sainsbury has decreased its net profit margin from 0.... Still, the main cash inflow comes from operating, which is a sign of financial health of a company.... The paper "Large UK Health and Beauty Retailing company" discusses that the deposited sum should inflate and equal foreign liability.... hellip; Option hedges allow a company to take one-sided bets on currency movements....
8 Pages (2000 words) Case Study

Investment decision

As the market conditions are improving, the operating risk will go down and by enhancing financial leverage management will be able to boost profitability of the company.... The company always maintained an aggressive growth strategy; at present it has an extension plan for which it has to raise KD 20 million.... Before finalizing the source of capital,… n in-depth analysis was conducted to determine Debt/Equity ratio and the available source of financing options for developing an optimum capital structure. After analyzing the Debt/Equity ratio for the last four years, it was found the company rely lot on the equity....
15 Pages (3750 words) Essay

Financial Performance of Sainsbury Plc and Tesco Ltd

One of the key tools to evaluate the financial performance of the firm and to assess… Financial ratio analysis provides a critical insight, trends as well as historical performance of the firm to evaluate as to how the firm has actually performed during a given period of time. Sainsbury Plc It is the parent company of Sainsbury Supermarkets Ltd involved in the retailing business in UK and other parts of the world.... Making investment decisions is one of the delicate jobs as it requires a comprehensive understanding of different parameters which can be considered to evaluate the performance of the firm....
6 Pages (1500 words) Essay

How Signaling Theory Can Be an Usefull for Investors

This suggests a positive relationship between the information asymmetry and dividend policy of the firm.... This theory, in its basic form, stipulates that the changes in the dividend policy actually convey the information to the investors about changes in the future cash flows of the firm.... This paper will provide theoretical and empirical evidence regarding how the signaling theory can explain the manager's decision to change capital structure and payout policy....
6 Pages (1500 words) Essay

Relative Strengths and Weaknesses of Performance Measurement Techniques at Sainsbury Plc

To have a perfect critique of the TSR of Sainsbury, it is important to relate the calculated TSR to the share price and dividend per share.... ?? In the figure below, the share price, dividend per share and calculated TSR of Sainsbury since 2009 are compared.... Having used these external performance measures for some time now, there are various strengths and weaknesses that can be… Market value added has been explained by to be the difference between the existing market value of the company and the capital contributed by investors of the company....
3 Pages (750 words) Essay

Northeast Utilities to buy NSTAR for $4.17 bln

It details us about the… Chief Executive NSTAR Thomas May explains that, there is a deal that allowed both the shareholders who earned more earnings and the growing dividend to Therefore, such deals were called to exchange 1.... While calculating the results, find that we computed the most necessary variables, as other additional calculations require that there is a standardized performance that is obtained using the statistical analysis.... New report from the company explains that, Reuters- the Northeast Utilities (NU....
4 Pages (1000 words) Thesis Proposal

Financial Management - the Capital Puzzle

On the financial ground, Aguia comprise of debt and equity but Pomba only equity.... In the general context, stock investor's takes there investment priority based on the strong fundamental aspects and strong balance sheet of the company.... Additionally, the capital structure of the company will provide signal to the investors regarding the valuation of the company in the marketplace.... For instance, company readily makes the decision to exchange part of debt in respect of the equity....
9 Pages (2250 words) Essay
sponsored ads
We use cookies to create the best experience for you. Keep on browsing if you are OK with that, or find out how to manage cookies.
Contact Us