StudentShare
Contact Us
Sign In / Sign Up for FREE
Search
Go to advanced search...
Free

Financial Analysis of Commonwealth Australia Bank and BHP Billiton and Calculation Net Present Value - Assignment Example

Cite this document
Summary
The paper illustrates the financial analysis of the two leading corporate firms in Australia, Commonwealth Bank of Australia and BHP Billiton. The paper takes an analytical approach wherein the financial reports of firms are used to analyze their financial performance in terms of earnings per share…
Download full paper File format: .doc, available for editing
GRAB THE BEST PAPER92.2% of users find it useful
Financial Analysis of Commonwealth Australia Bank and BHP Billiton and Calculation Net Present Value
Read Text Preview

Extract of sample "Financial Analysis of Commonwealth Australia Bank and BHP Billiton and Calculation Net Present Value"

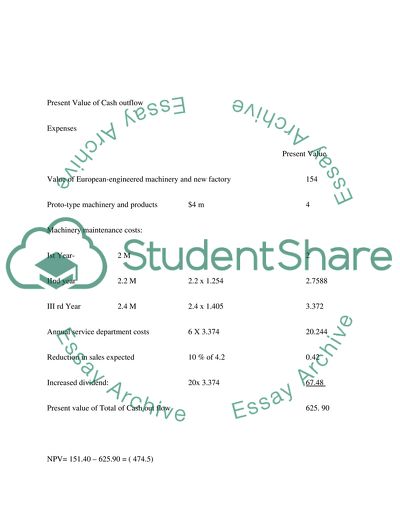
PROJECT EVALUATION Question a) Calculation Net Present Value (NPV) of new investment proposal Net Present Value is the difference between the present value of cash inflow and the present value of cash outflow. An investment opportunity is advised to accept only when the NPV is positive and otherwise the project is said to be ineligible for investment. Here the investment will be achieving return in the next five years of investment and the anticipated return of the firm from similar kind of investment is 12%. Therefore, the present value factor with which the future likely return s converted is 3.605 (at 12% for three years annuity). Present Value of Cash Inflow The annual return for the next five years is given as $60 M less $18 M cost of goods sold and other expenses. Therefore, the annual return from investment comes to $42 M and the present value is computed as below: $42 x 3.605 = $ 151.41m Thus, the Present Value of Cash inflow = 151.41 M Present Value of Cash outflow Expenses Present Value Value of European-engineered machinery and new factory 154 Proto-type machinery and products $4 m 4 Machinery maintenance costs: Ist Year- 2 M 2 IInd year 2.2 M 2.2 x 1.254 2.7588 III rd Year 2.4 M 2.4 x 1.405 3.372 Annual service department costs 6 X 3.374 20.244 Reduction in sales expected 10 % of 4.2 0.42 Increased dividend: 20x 3.374 67.48 Present value of Total of Cash out flow 625. 90 NPV= 151.40 – 625.90 = ( 474.5) Since the NPV is negative, the project is not advisable for investment b) critically analyze the advantages and disadvantages of three different techniques of project evaluation other than net present value Pay Back Period Pay Back Period is the oldest and most commonly used method for evaluating the profitability of projects. This method is based on certain convention that the business concerns would give more importance to recovery of the original investment as the first compared to the earning of profit. Pay Back Period represents the period (in terms of number of years) which is required to recoup the original cost of investments. As regards the selection criteria as per this method, the project with shorter payback period is selected as compared to project having higher pay back period (Groppelli and Ehsan, 2006). The advantages of the method include: It is very easy to calculate and simple to understand. It helps to save cost, as it requires less time and labor. It reduces the possibility of losses through technological obsolescence. It is helps lot especially to those business projects that have small amount of cash and who are very much eager to get back their cost of investment within a shorter period. Benefit Cost Ratio Benefit Cost Ratio is used to compare the projects having different investment outlays. The name itself tells the meaning of this method. It can be understood as the ratio of Present Value of Cash in Flows at the required rate of return on the initial Cash out Flow of the investment ( Drury, 2006). Like Pay Back period, Benefit Cost ration is also known by other names such as, ‘Profitability Index’ or ‘Desirability Factor’ or ‘Value Investment Ratio’ or ‘Profit Investment Ratio’. The selection criteria of this method is that project is accepted if the Profitability Index is greater than one and rejected if Profitability Index is less than one. It considers the concept of Time Value of Money. It can be used to compare the two projects having different investment outlays which the Net Present Value cannot do. It also considers the fair rate of return. This method is based upon the true profitability of projects. Internal Rate of Return Internal Rate of Return is the rate of return which equates the total present value of future cash flow returns to the initial cash out flow of the investment or where Net Present Value is Zero. This method is also known by other names such as ‘time adjusted rate of return’ or ‘discount rate of return’ or ‘marginal rate of return’ ( Gorman, 2003). To select a feasible project internal rate of return is compared with cost of capital or the required rate of return. Therefore if a project where the Internal Rate of Return is equal or greater than cost of capital is selected otherwise rejected. It considers the concept of Time Value of Money. This method can provide a sound decision as the factor cost of capital is taken for appraisal. It considers all the cash flow returns over the entire life of the project. It can also provide true profitability of the project in the absence of cost of capital. Question 2 Financial Analysis of Commonwealth Bank of Australia and BHP Billiton Executive Summary This report illustrates the financial analysis of the two leading corporate firms in Australia. The firms selected for analysis are Commonwealth Bank of Australia and BHP Billiton. The report takes an analytical approach wherein the financial reports of both firms are extensively used to analyze their financial performance in terms of earnings per share and dividend paid for the last five years. The financial analysis is performed using the dividend paid and earnings per share attained by the company for the last five financial years. For this purpose earnings per share and dividend pay-out ratios have been computed using the annual reports of both firms. Over view of Commonwealth Bank of Australia and BHP Billiton Ltd Commonwealth Bank of Australia (Commonwealth Bank) is one of country’s leading financial institutions offering a large number of integrated financial products and services. The bank offers a wide variety of financial services such as retail banking, premium banking, business banking and many more. The major business of the bank involves banking, funds management and insurance business. The services of the bank are offered to the customers through four divisions namely retail banking services, premium business services, wealth management, and international financial services. BHP Billiton Ltd, founded in 2001 after the merger of BHP Limited and Billiton Plc has become one of the worlds principal diversified assets company, with a collection of high-quality, long-life properties and a significant number of prosperous projects. With headquarter in Melbourne, the company has listings on the Australian and London Stock Exchanges and perform its day to day business under seven Customer Sector Groups (CSGs). The company’s key activities include extracting minerals, oil and gas and processing those resources to be available among nine customer sector groups. Dividend Policy and Payout ratio Commonwealth Bank of Australia Table 1 Earnings per share and Dividend per share for the last five years (Amount in US$ Million) Period Earnings Per Share Dividend Per Share December 2008 142 115 June 2008 363 266 % increase (or decrease) (60) (56.7) December 2007 180 113 June 2007 344.7 256 % increase (or decrease) (47.7) (55.8) December 2006 169.6 107 June 2006 308.2 224 % increase (or decrease) (44.9) (52.2) December 2005 157.1 94 June 2005 303.1 197 % increase (or decrease) (48.1) (52.2) December 2004 141.6 85 June 2004 111.23 93.5 % increase (or decrease) 27.3 9 (Source: Annual Financial Reports for 2004; 2005; 2006; 2007 and 2008) The above table exhibits that the bank has been following a steady dividend policy for the last five years. However the volume of payment has been affected as a result of the decrease in earnings per share from year to year. Though the figures shows that the EPS has been declining from June to December every year, the bank’s financial statements shows a steady increase as regards the annual figures are taken into account. Similarly, the dividend payment also shows a decrease from June to December every year except 2004. However, the bank has tried to follow a regular dividend policy and more or less similar rate has been made throughout the five year period. Table 2 Payout Ratio for the last five years (Amount in US$ Million) Period Payout Ratio December 2008 82.4 June 2008 74.1 % increase (or decrease) 11.2 December 2007 63.4 June 2007 75.2 % increase (or decrease) (15.7) December 2006 63.8 June 2006 73.3 % increase (or decrease) (12.96) December 2005 60.6 June 2005 65.2 % increase (or decrease) (7) December 2004 60.2 June 2004 93.5 % increase (or decrease) (35.6) (Source: Annual Financial Reports for 2004; 2005; 2006; 2007 and 2008) The above table is meant to disclose the dividend payment made by Commonwealth Bank of Australia to its shareholders for the last five years. It is clear from the tale that the company has been paying regular dividend. However the bank could not paid a constant dividend from year to year. This has not been possible for the bank as its EPS were also subject to fluctuation for the past five years. It is also seen from the table that payout ratio shows a positive trend except few years. It is unusual in the year 2004 that the bank paid around 94 % of its earnings per share as dividend. BHP Billiton Ltd Table 3 Earnings per share and Dividend per share for the last five years3 (Amount in US$ Million) Period Earnings Per Share Dividend Per Share December 2008 47 41 June 2008 275 70 % increase (or decrease) (82.9) (44.28) December 2007 107.2 29 June 2007 229.5 47 % increase (or decrease) (53.2) (38.2) December 2006 103.9 20 June 2006 173.2 36 % increase (or decrease) (40) (44) December 2005 72.1 17.5 June 2005 104.5 28.6 % increase (or decrease) (31) (38.8) December 2004 47.7 13.5 June 2004 54.3 26 % increase (or decrease) (12.2) (48) (Source: Annual Financial Reports for 2004; 2005; 2006; 2007 and 2008) The above table shows that the BHP Billiton Ltd has a comfortable EPS and out of the EPS earned, the company has paid an insignificant amount as dividend among its owners. Table No. 4 illustrates the dividend payout ratio of the company for the last five years. Table 4 Payout Ratio for the last five years (Amount in US$ Million) Period Payout Ratio December 2008 87.2 June 2008 25.4 % increase (or decrease) 243 December 2007 16.8 June 2007 20.47 % increase (or decrease) (17.9) December 2006 19.24 June 2006 20.78 % increase (or decrease) (7.4) December 2005 24.2 June 2005 27.3 % increase (or decrease) (11.3) December 2004 28.3 June 2004 47.8 % increase (or decrease) (40.79) (Source: Annual Financial Reports for 2004; 2005; 2006; 2007 and 2008) It is clear from the above table that the company has paid regular dividend to its owners. However, the payout ratio has not been much satisfactory from the investors’ point of view. It is evident that the company has not paid more than 50 % of its EPS except in the year 2008. This is a positive signal to the investors that their money with the company get multiplied with every rupee earned by the company. Debt to Equity Ratio The debt to equity ratio (D/E Ratio) is one of the poplar ratios used by analysts to examine the debt capacity of a firm. It is calculated by dividing the debt (long term) by the equity value available to its shareholders in total (Bragg, 2002). BHP Billiton Ltd Table 5 Debt Equity Ratio (Amount in US$ Million) 2008 2007 2006 2005 2004 Debt 20475 20460 18368 21668 19688 Equity 39649 31258 28448 24326 28645 Ratio 52 65 64 89 69 (Source: Annual Financial Reports for 2004; 2005; 2006; 2007 and 2008) The above table exhibits the debt equity ratio of the company for the last five years. The table makes it clear that the firm has a comfortable position in the long term debt capacity except in 2005 wherein the firm has funded significant amount from external sources. In all other years the firm has tried not to increase the borrowing more than 70% of its total equity. Commonwealth Bank Ltd Table 6 Debt Equity Ratio (Amount in US$ Million) 2008 2007 2006 2005 2004 Debt 11559 14368 14328 16848 21780 Equity 26137 22388 18258 22368 22654 Ratio 44 64 78 75 96 (Source: Annual Financial Reports, Commonwealth Bank Ltd for 2004; 2005; 2006; 2007 and 2008) Table 6 shows the debt equity ratio of Commonwealth Bank Ltd since 2004. The bank has been using debt financing from different sources all the given years and not less than 50% of equity values is funded from debt sources except the year 2008. It is highly noticeable that the bank borrowed a huge amount in 2004, which is not less than 95% of the value of equity. References Annual Reports- 2008, Commonwealth Bank of Australia, accessed on 29th October, 2009 from http://www.commbank.com.au/about-us/shareholders/pdfs/annual-reports/2008_Annual_report.pdf Annual Reports- 2007, Commonwealth Bank of Australia, accessed on 30th October, 2009 from http://www.commbank.com.au/about-us/shareholders/pdfs/annual-reports/2007_Concise_Annual_report_final.pdf Annual Reports- 2006, Commonwealth Bank of Australia, accessed on 31st October, 2009 from http://www.commbank.com.au/about-us/shareholders/pdfs/annual-reports/2006_Concise_Annual_report_june.pdf Annual Reports- 2005, Commonwealth Bank of Australia, accessed on 28th October, 2009 from http://www.commbank.com.au/about-us/shareholders/pdfs/annual-reports/2005_Concise_Annual_report_june.pdf Annual Reports- 2004, Commonwealth Bank of Australia, accessed on 30th October, 2009 from http://www.commbank.com.au/about-us/shareholders/pdfs/annual-reports/2004_Concise_Annual_report.pdf Annual Reports- 2008, BHP Billiton Ltd, accessed on 29th October, 2009 from http://www.bhpbilliton.com/bbContentRepository/docs/annualReport2008.pdf Annual Reports- 2007, BHP Billiton Ltd, accessed on 31st October, 2009 from http://www.bhpbilliton.com/bb/investorsMedia/reports/2007/2007BhpBillitonAnnualReportPage.jsp Bragg, M. Steven (2002), Business ratios and formulas: a comprehensive guide, John Wiley and Sons Drury, Colin (2006) Management and cost accounting, Cengage Learning EMEA Gorman, Tom (2003), The complete idiots guide to MBA basics, Alpha Books Groppelli, A. Angelico and Ehsan Nikbakht (2006), Finance, Barrons Educational Series News Release, BHP Billiton Results for the year ended 2009, BHP Billiton Ltd, accessed on 31st October, 2009 from http://www.bhpbilliton.com/bbContentRepository/docs/summaryReview2009.pdf News Release, BHP Billiton Results for the year ended 2008, BHP Billiton Ltd, accessed on 28th October, 2009 from http://www.bhpbilliton.com/bbContentRepository/docs/businessReview2008.pdf News Release, BHP Billiton Results for the year ended 2008, BHP Billiton Ltd, accessed on 30th October, 2009 from http://www.bhpbilliton.com/bbContentRepository/docs/bhpBillitonConcise2008.pdf News Release, BHP Billiton Results for the year ended 2007, BHP Billiton Ltd, accessed on 30th October, 2009 from http://www.bhpbilliton.com/bbContentRepository/20071114332570/bhpbannualreview07.pdf News Release, BHP Billiton Results for the year ended 2006, BHP Billiton Ltd, accessed on 28th October, 2009 from http://www.bhpbilliton.com/bbContentRepository/20061012146404/bhpbreview2006.pdf Annual Reports- 2006, BHP Billiton Ltd, accessed on 27th October, 2009 from http://www.bhpbilliton.com/bb/investorsMedia/reports/2006/2006BhpBillitonAnnualReportPage.jsp News Release, BHP Billiton Results for the year ended 2005, BHP Billiton Ltd, accessed on 28th October, 2009 from http://www.bhpbilliton.com/bbContentRepository/Reports/bhpb_ltd_concise_ar05.pdf News Release, BHP Billiton Results for the year ended 2004, BHP Billiton Ltd, accessed on 27th October, 2009 from http://www.bhpbilliton.com/bbContentRepository/Reports/bhpb_ltd_full_04.pdf Read More
Tags
Cite this document
  • APA
  • MLA
  • CHICAGO
(Financial Analysis of Commonwealth Australia Bank and BHP Billiton and Assignment, n.d.)
Financial Analysis of Commonwealth Australia Bank and BHP Billiton and Assignment. Retrieved from https://studentshare.org/finance-accounting/1728888-corporate-finance-q2project-evaluation-in-practise-q1company-reports
(Financial Analysis of Commonwealth Australia Bank and BHP Billiton and Assignment)
Financial Analysis of Commonwealth Australia Bank and BHP Billiton and Assignment. https://studentshare.org/finance-accounting/1728888-corporate-finance-q2project-evaluation-in-practise-q1company-reports.
“Financial Analysis of Commonwealth Australia Bank and BHP Billiton and Assignment”, n.d. https://studentshare.org/finance-accounting/1728888-corporate-finance-q2project-evaluation-in-practise-q1company-reports.
  • Cited: 0 times

CHECK THESE SAMPLES OF Financial Analysis of Commonwealth Australia Bank and BHP Billiton and Calculation Net Present Value

Australian Foreign and Defence Policy

China's emergence, as has been argued by popular strategic thinkers of australia, does not reach comfortably into the deepest precincts of the joint Australian intuitive or subconscious like no other historical occurrence since the year 1942 has (Emerson, 2001, p.... It is therefore in this sense that the rise of China, if it is not dealt with in good time and becomes a big issue to an extent of successfully degrading the influence of the United States in the East Asia region, poses a pose a serious and direct challenge to the identity of australia....
2 Pages (500 words) Speech or Presentation

Finicial Evaluation of Techologies

Calculate the Present Worth (that is, the net present value [NPV] of total costs) for each of the technologies for the real discount rates and periods of assessment as specified in the following tables (please present results in this format):Technology AAssessment periodDiscount rate   (years)5%10%15%20%5 0.... But in the case of a technology that still has a useful lifetime remaining at the end of a period, do not analysis of two energy proposals Two electri supply technologies have the following characteristics:   Capital cost Annual operating cost Lifetime (years)Salvage value (/cost) ($)Annual electricity supplied (kWh)Technology A (a sustainable energy option)20 00050020200025 000Technology B (a fossil fuel option)10 000300010-200025 0001....
2 Pages (500 words) Speech or Presentation

Financial crime

The company got itself into riskier financial products as it allowed collateralized assets groups and subprime mortgage pools to invest in credit default swaps, since it would not be possible to assess the real value of these groups.... The accounting strategy that contributed considerably to the company's downfall was the “fair-value” accounting... AIG, the American insurance giant would have been subject to the greatest financial crisis of America if not for the $85 billion rescue loan offered by the government....
3 Pages (750 words) PowerPoint Presentation

Quantitative methods Assignment - a few exercises and calculations

(i) The net year end cash… Calculate the net present value of the project, using a discount rate of 8%.... Enter the total net present value in the table below. ... Please let me know if it doesnt fir into three pages.... It should as the professor required not to write much but it is important to show formulas and process used to achieve results. ...
3 Pages (750 words) Speech or Presentation

Financial questions and calculations

This capital turned out to be dud capital during the financial crisis as the profits which were booked temporarily to cover market risk turned out… f) Proposals for the Basel 3 Accord include minimum capital requirements.... By January 2015, common equity Tier 1 capital (CET1 – comprising ordinary shares and retained earnings, which are the main component of Tier 1 capital) must be at least 4....
4 Pages (1000 words) Speech or Presentation

Lower Division Capstone

Gross Domestic Product(GDP) usually refers to the market value of the goods and services which have been produced in the country during a specific period (Sullivan, 2008).... or calculating GDP according to this method first of all the gross value of domestic output in various economic activities is estimated....
1 Pages (250 words) PowerPoint Presentation

Crop Insurance Proposal Could Cost U.S. Billions

ccording to a Government Accountability Office, the costs of the crop insurance programme have augmented since the raise in the value of the crops.... Congress is considering launching an insurance programme for farmers covering their losses and the price drop in crops as well as a low yield....
1 Pages (250 words) PowerPoint Presentation

Principle of Accounting

The business, as a legal entity, owes the capital to the owner; just as it owes bank loan to a bank.... From this work, it is clear about the financial lease and all risks connected with ownership.... This work called "Principle of Accounting" describes the aspects of Manufacturing Business, all its peculiarities....
7 Pages (1750 words) Speech or Presentation
sponsored ads
We use cookies to create the best experience for you. Keep on browsing if you are OK with that, or find out how to manage cookies.
Contact Us