StudentShare
Contact Us
Sign In / Sign Up for FREE
Search
Go to advanced search...
Free

Portfolio Theory and Investment Analysis - Research Paper Example

Cite this document
Summary
This paper "Portfolio Theory and Investment Analysis" discusses The charity that has a market capitalization of £8 million. The present portfolio of this charity is concentrated in equity shares in 7 leading U.K. companies. Around 40% of the portfolio is invested in one of these stocks…
Download full paper File format: .doc, available for editing
GRAB THE BEST PAPER95.3% of users find it useful
Portfolio Theory and Investment Analysis
Read Text Preview

Extract of sample "Portfolio Theory and Investment Analysis"

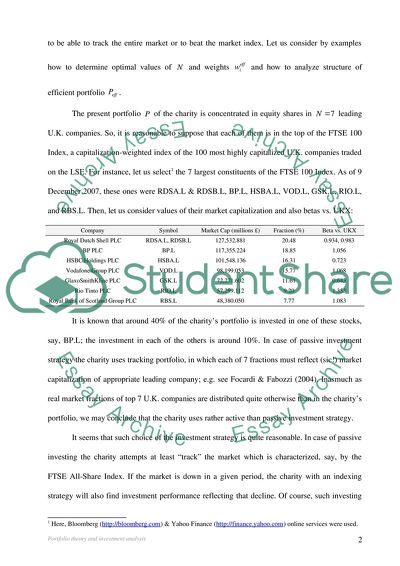
Portfolio theory and investment analysis Synopsis of tasks The charity has market capitalization of £8 million. The present portfolio of this charityis concentrated in equity shares in 7 leading U.K. companies. Around 40% of the portfolio is invested in one of these stocks; the investment in each of the others is around 10%. The average monthly correlation between the stocks is 0.65 and the portfolio beta against the FT All Share Index is 1.03. It is necessary to analyze by examples: the impacts of having a small number of stocks in the portfolio (problem A1) and concentrating the investment in large stocks (problem A2); the benefits of moving some of the investment to international securities (problem B); and how derivatives may be used to enhance returns (problem C1) and manage risk (problem C2). In fact, it is required to estimate current investment strategy of the charity and then to propose actions for its improvement. Problems A1 & A2 These problems (and also the following ones) can be formulated and then analyzed in terms of optimally diversified portfolios; e.g. see Bodie et al (2003) and Elton et al (2003). Let us suppose that the portfolio has stocks. Structure of is determined by weights of stocks, . Per se, efficient portfolio allows the charity to obtain high expected values of return under tolerable value of risk. Efficient portfolio is determined by optimal weights of stocks, . In general, portfolios with high values of allow to achieve well optimized and efficient solutions but such portfolios are expensive to operate and difficult to analyze and manage. On the other hand, portfolios with small values of are cheap to operate and easy to manage but often such portfolios are too weakly diversified to be able to track the entire market or to beat the market index. Let us consider by examples how to determine optimal values of and weights and how to analyze structure of efficient portfolio . The present portfolio of the charity is concentrated in equity shares in leading U.K. companies. So, it is reasonable to suppose that each of them is in the top of the FTSE 100 Index, a capitalization-weighted index of the 100 most highly capitalized U.K. companies traded on the LSE. For instance, let us select1 the 7 largest constituents of the FTSE 100 Index. As of 9 December 2007, these ones were RDSA.L & RDSB.L, BP.L, HSBA.L, VOD.L, GSK.L, RIO.L, and RBS.L. Then, let us consider values of their market capitalization and also betas vs. UKX: Company Symbol Market Cap (millions £) Fraction (%) Beta vs. UKX Royal Dutch Shell PLC RDSA.L, RDSB.L 127,532.881 20.48 0.934, 0.983 BP PLC BP.L 117,355.224 18.85 1.056 HSBC Holdings PLC HSBA.L 101,548.136 16.31 0.723 Vodafone Group PLC VOD.L 98,199.053 15.77 1.068 GlaxoSmithKline PLC GSK.L 72,271.602 11.61 0.643 Rio Tinto PLC RIO.L 57,299.112 9.20 1.353 Royal Bank of Scotland Group PLC RBS.L 48,380.050 7.77 1.083 It is known that around 40% of the charity’s portfolio is invested in one of these stocks, say, BP.L; the investment in each of the others is around 10%. In case of passive investment strategy the charity uses tracking portfolio, in which each of 7 fractions must reflect (sic!) market capitalization of appropriate leading company; e.g. see Focardi & Fabozzi (2004). Inasmuch as real market fractions of top 7 U.K. companies are distributed quite otherwise than in the charity’s portfolio, we may conclude that the charity uses rather active than passive investment strategy. It seems that such choice of the investment strategy is quite reasonable. In case of passive investing the charity attempts at least “track” the market which is characterized, say, by the FTSE All-Share Index. If the market is down in a given period, the charity with an indexing strategy will also find investment performance reflecting that decline. Of course, such investing is a low-cost strategy due to reduced security analysis and insignificant start portfolio management costs. However, there are certain tracking errors when the tracking portfolio can not follow exactly to the long-term index dynamics. Indeed, it is difficult to realize tracking portfolio of several tens of fractions which will reflect index of the market representing hundreds of companies. Therefore the simplest “buy-and-hold” approach needs in some adaptations, i.e. the tracking portfolio corrections. Hence, passive charity’s portfolio management incurs a number of transaction costs, namely for adapting the portfolio to the index, for reinvesting etc. For these reasons, the return on a real tracking portfolio can be somewhat lower than that of the market index. In our case investor attempts to outperform the market through superior stock selection and therefore beat the market index. Such active investing is a high-cost strategy due to advanced security analysis and essential start portfolio management costs. Indeed, the key aim of active investing is to estimate existing stocks (i.e. to compute expected returns and risks of single investments), then to construct efficient frontier and the target portfolio using expensive analytical techniques; see details in Reilly & Brown (2002) and in Bodie et al (2003). Here, some stocks in the target portfolio can have negligible optimal weights ; in such cases total number of ‘working’ stocks of can be less then total number of all stocks in . Hence, we can obtain effect of concentrating the investment in few large stocks. On the other hand, some high-risky but profitable shares can be out of the present portfolio with small value of , i.e. high target returns can be unobtainable for weakly diversified portfolio. Hence, inconsiderate truncation of potential shares can be harmful for the charity when using active (sic!) investing strategy. Let us explain this problem in detail by using two main approaches for constructing optimal portfolio, namely via efficient frontier and via achieving target beta. Firstly, individual price data allow us to estimate key characteristics of single investments, namely expected value of return () and standard deviation (), . Exact configuration of efficient portfolio is not defined by and only. Indeed, structure of will depend also upon correlations between price data of single shares and the target rates of return. It is known that the average monthly correlation between the stocks of the charity’s portfolio is 0.65. It means that trends of individual monthly returns are weakly but positively interrelated. Therefore, we may suppose that characteristics of individual investments (i.e. and ) are more important for this case than correlations between single monthly returns. Therefore, roles of single stocks within are obvious and predictable, e.g. portfolio with high expected return will be constructed mainly by shares with bigger values of and acceptable values of , etc. Then, to get precise structure of , it is necessary to construct efficient frontier, i.e. the envelope curve of all portfolios that lie between the global minimum variance portfolio and the maximum return portfolio; e.g. see Bodie et al (2003). As a rule, has lesser value of the standard deviation (i.e. risk) with the same mean (i.e. expected return) as the present portfolio or the equally weighted portfolio, so it is possible to obtain significant reduction of risk. It is essential for our problem that efficient weights of can differ radically (sic!) from equal or present weights. So, this is an idea for solution: while active portfolio management, there is no need to limit number of shares manually or distribute weights in the present charity’s portfolio non-trivially. Indeed, it is possible to compute optimal weights and hence to obtain number of ‘working’ stocks automatically; see details of such computations in Bodie et al (2003). For instance, in the risk-return plane the global minimum variance portfolio can be located near one (or two) dominating investment, say, GSK.L or HSBA.L (note that each of them has small beta value). Also, the maximum return portfolio can be positioned near another dominating investment, say, RIO.L (note that it has highest beta value). In these critical cases we obtain very simple portfolios with few large stocks. It is necessary to note that individual investments usually have worse ratio than this one () for the portfolios on the efficient frontier. Of course, portfolios with higher values of target returns will have higher values of risks . Portfolios on the efficient frontier can be constructed from several ‘working’ stocks with essential weights. Though technical details of such constructing are far beyond this assignment, it is possible to make some notes about structure of . For different target returns we will obtain different dominating and ‘working’ stocks; equally weighted portfolios on the efficient frontier are also possible. When single stocks have similar investment characteristics ( and ), most likely we will obtain equally weighted portfolio on the efficient frontier. When portfolio contains one or two stocks with strongly differing characteristics (, or , or individual beta) from those ones of other stocks, it is reasonable to assume that such ‘standing out’ stocks will have strongly differing weights in the efficient portfolio (if correlation between individual stocks is negligible). For instance, the present portfolio of the charity is described by following weights: (say, for BP.L which ‘stands out’), (for other blue chips). In any case, exact structure of must be computed by varying weights of individual stocks to obtain target return and minimal risk; see details of such procedure in Bodie et al (2003). Only after this, we may compute required investments (millions £), expected returns (millions £) of each stock, and expected return of the entire efficient portfolio (millions £) assuming that the charity has a pool of £8 million. Why we said above that BP.L stock ‘stands out’? Let us suppose that we use alternative investment technique, namely forming a portfolio based upon a target beta. For instance, the charity’s portfolio has a target beta of 1.03. Let us provide structure of a portfolio (i.e. weights of its stocks) that conforms to this target beta. It is well known that the beta is a measure of the sensitivity of a single stock to market movements. Usually high-beta shares give the highest returns. A beta of 1 indicates that the security’s price will move with the market (for instance, RDSA.L, RDSB.L and BP.L). A beta of less than 1 means that the security will be less volatile than the market (for instance, HSBA.L and GSK.L). A beta of greater than 1 indicates that the security’s price will be more volatile than the market (for instance, RIO.L). Beta of portfolio can be computed as weighted sum of single betas; see e.g. Elton et al (2003). For the present portfolio we really can obtain a target beta; more precisely, combination of RDSA.L & RDSB.L (9.0%), BP.L (40.5%), HSBA.L (9.5%), VOD.L (10.0%), GSK.L (8.0%), RIO.L (13.0%), and RBS.L (10.0%) gives portfolio beta of 1.025. So, BP.L stock ‘stands out’ here, i.e. dominates in the portfolio . Here, it is essential to note that to construct minimum-risk (sic!) portfolio for a target beta we must use analytical methods described e.g. by Bodie et al (2003), but this is far beyond the stated problems. Problem B Let us discuss the benefits of moving some of the charity’s investment to international securities. Though the charity uses active investment strategy, the present portfolio is constructed from leading national companies, e.g. BP.L or VOD.L. What we may expect from the international investments? It is known that adding to a portfolio assets with small values of correlation coefficient will enhance the reward-to-volatility ratio; see Elton et al (2003) and Bodie et al (2003). As Bodie notes, “Increasing globalization lets us take advantage of foreign securities as a feasible way to extend diversification” (Bodie et al 2003, p.849). So, the risk of an internationally diversified portfolio can be reduced in comparison with the risk of a diversified U.K. portfolio. How to explain such effect? MSCI data show that although the correlation coefficients between the FTSE 100 Index and stock- and bond-index portfolios of other large economies (U.S., Japan, Germany, France, etc.) are typically positive, they are much smaller than 1.0; most correlations are below 0.5. For instance, we have following challenging correlations of the FTSE 100 Index with overseas equity markets: 0.42 (for Germany), 0.25 (for Japan), and 0.40 (for emerging markets). In contrast, correlation coefficients between diversified U.K. portfolios are much higher. This imperfect correlation across national boundaries allows for the improvement in diversification potential; cf. Bodie et al (2003). Moreover, it is possible to compare risk-return opportunities offered by equity indexes of several countries, alone (national investing) and combined into portfolios (international investing). Though detailed estimations are beyond this assignment, we may suppose that the efficient frontiers generated from the full set of assets (international investing) will offer the best possible risk-return pairs; these ones will be far superior to the risk-return profile of U.K. stocks alone (national investing). Problems C1 & C2 Let us briefly consider how derivatives may be used to enhance investment returns and manage risk. In general, options can guide portfolio management decisions. Their sensitivity measures can be helpful in determining the impact of portfolio management decisions on the portfolio’s risk characteristics; e.g. see Hull (2002) and Focardi & Fabozzi (2004). For instance, derivatives can be used to control risk, e.g. options can be used for hedging. Here, the option sensitivity measures, or the Greeks, must be used to construct portfolio hedges with options. The Greeks can characterize not options itself but also the risk exposure of a portfolio that includes options and other assets. Because it is possible to formulate how individual options contribute to a portfolio’s overall risk (Focardi & Fabozzi 2004, p. 140-164), we can determine what adjustments are necessary to hedge the risk exposure of the charity’s portfolio. As yield of options is opposite to yield of basic portfolio assets, value of risk for the portfolio can be decreased owing to decreasing of the expected return of the portfolio. Then, it is possible to use options to ensure that the value of a portfolio cannot fall below a given amount. By combining a long position in a put option with a long position in the underlying asset, we can ensure that the value of the combined portfolio cannot fall below a given level. An outright investment in a portfolio can be transformed into an investment with a completely different risk profile through this technique. Portfolio insurance can also be implemented synthetically by using futures contracts in a dynamic hedging strategy; see details in Focardi & Fabozzi (2004).. So, we obtain the risk/expected return trade-off implied by portfolio insurance strategies. In fact, portfolio insurance protects against large losses by sacrificing the chance for large gains. As Fabozzi notes, “By paying the insurance, the insured knows that the expected return on the portfolio will be less than it would be without insurance, but the insured hopes to avoid the extreme loss” (Focardi & Fabozzi 2004, p. 154). References Bodie, Z, Kane, A, and Marcus A 2003, Investments, McGraw-Hill/Irwin, New York. Dupacova, J, Hurt, J, and Stepan, J 2003, Stochastic modeling in economics and finance, Kluwer Academic Publishers, New York. Elton, J, Gruber, M, Brown, S, and Goetzmann, W 2003, Modern portfolio theory and investment analysis, John Wiley & Sons, New York. Focardi, S, and Fabozzi, F 2004, The mathematics of financial modelling and investment management, John Wiley & Sons, New York. Jackson, C 2003, Active investment management: finding and harnessing investment skill, John Wiley & Sons, New York. Hagin, RL 2004, Investment management: portfolio diversification, risk, and timing, John Wiley & Sons, New York. Hull, JC 2002, Options, futures, and other derivatives, Prentice Hall, Upper Saddle River. Reilly, F, and Brown, K 2002, Investment analysis and portfolio management, CFA Association for Investment Management and Research, New York. Read More
Cite this document
  • APA
  • MLA
  • CHICAGO
(Portfolio Theory and Investment Analysis Research Paper, n.d.)
Portfolio Theory and Investment Analysis Research Paper. Retrieved from https://studentshare.org/finance-accounting/1710681-portfolio-theory-and-invesntment-analysis
(Portfolio Theory and Investment Analysis Research Paper)
Portfolio Theory and Investment Analysis Research Paper. https://studentshare.org/finance-accounting/1710681-portfolio-theory-and-invesntment-analysis.
“Portfolio Theory and Investment Analysis Research Paper”. https://studentshare.org/finance-accounting/1710681-portfolio-theory-and-invesntment-analysis.
  • Cited: 0 times

CHECK THESE SAMPLES OF Portfolio Theory and Investment Analysis

Theory and concepts of creating a financial model

It is important to note that the concept of Modern portfolio theory to show the connection between the risk and return of a portfolio of financial assets.... It is also able to calculate returns and perform ration analysis.... Financial models are created to evaluate virtually everything from borrowing requirements to investment performance.... Financial models for investment options or product services are often custom developed in excel sheets as they take into account for unique characteristics such as cost structure, product market and competitive situation....
4 Pages (1000 words) Essay

The impact of the crisis

The Impact of the Crisis Contents Contents 2 Introduction 3 Background of the crisis 3 Situation during the crisis 5 Effect of the debt crisis on the Financial Markets of Euro zone countries 6 Conclusion 7 References 9 Introduction The sovereign debt crisis took its worst form in the May 2010 and had it effect on the entire Europe....
8 Pages (2000 words) Essay

Investment Analysis Process

investment analysis Professor Date Introduction investment analysis is basically the process of finding out how a given investment is likely to perform.... hellip; Portfolio management strategy requires investment analysis for the sake of proper analysis and having the basic knowledge of what is happening to an investment.... In any investment analysis, one should be able to look at the prevailing price at that particular time as well as well as having reasons for having an investment at that particular time....
5 Pages (1250 words) Assignment

How to Maximise Shareholder Wealth

Such claims are limited by the proportion of ownership derived from the amount of investment.... Every investment decision is made with the expectation that its value would increase over time.... Neither is the investment totally risk-free since the share's value could drop because of mismanagement and bankruptcy.... The agency theory describes the dynamics of the relationship and potential conflicts of interest between shareholder-owners and manager-agents....
6 Pages (1500 words) Essay

Financial Markets Assignment

Laffer theory and common experience postulate that general economic factors impact stock prices in the aggregate.... Canto & Associates has focused on developing a portfolio strategy that would identify differential performance based on overall economic environment, location, and size....
6 Pages (1500 words) Essay

Short and Long-Term Returns on Overseas Market Development

The emerging markets of China, India and Indonesia are particularly attractive to foreign investors. Many of the plausible explanations for the growth in overseas investment and much of the background to the economic analysis presented here has been spurred by the growth of multinational companies.... Equally tariff barriers to trade can encourage direct investment, but non-tariff barriers are also important.... Many services are not exportable in any direct sense and have to be delivered in the overseas market through direct investment....
5 Pages (1250 words) Essay

Planning personal finance

The traditional lifecycle investing theory that was authored by Modigliani and Miller, holds that every individual will pass through several lifecycle stages, within which then needs for investment are different (Brigham & Houston, 200, pp.... nbsp; The first stage is when younger, exists the 'accumulation phase' (between 20's and 30's age periods), when the person is capable of investing in greater risk assets as well as follow an aggressive strategy of investment, designed to attain maximum longer term growth....
10 Pages (2500 words) Essay

Debt Ratio - Samsung, Apple, and Google

Modern Portfolio Theory and Investment Analysis.... In this case, Apple has the highest ROA and, therefore, it is profitable than both Google, and Samsung. Debt ratio is an indicator of the solvency status of an Question Return on asset is a financial analysis tool that shows the efficiency of a firm ingenerating profit using its assets.... Question 3 For one to be successful in stock market like Warren Buffet, critical analysis need to be conducted on the financial performance of the interested company....
1 Pages (250 words) Coursework
sponsored ads
We use cookies to create the best experience for you. Keep on browsing if you are OK with that, or find out how to manage cookies.
Contact Us