StudentShare
Contact Us
Sign In / Sign Up for FREE
Search
Go to advanced search...
Free

Stocks from Companies: Exxon and Berkshire - Essay Example

Cite this document
Summary
This essay "Stocks from Companies: Exxon and Berkshire" aims at establishing the value of stocks from capitalized companies, Exxon and Berkshire, in a given portfolio. The analysis of the two stocks in this paper is achieved through a methodology section, results, and a concluding remark…
Download full paper File format: .doc, available for editing
GRAB THE BEST PAPER92.4% of users find it useful
Stocks from Companies: Exxon and Berkshire
Read Text Preview

Extract of sample "Stocks from Companies: Exxon and Berkshire"

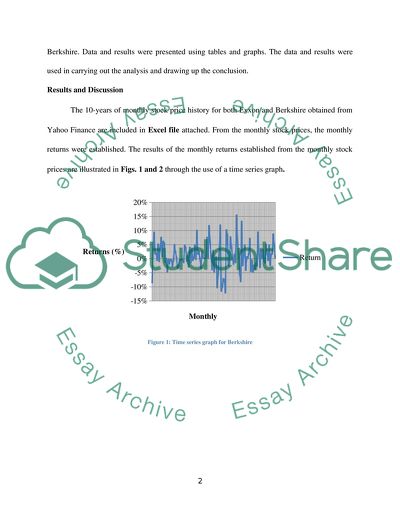
Security Analysis and Portfolio Management Section A: Stock Analysis Introduction Investment has been a fundamental and a major concept within the global economy. In every economy there are investors who buy stocks or securities from different organizations. Securities or stocks are assets that have financial values (Kevin, 2006). However, the questions of the right stock or security (in terms of value and profitability) to purchase and the management of the investment have always been impediment to extensive investment. In order to overcome such impediments, financial experts or security analysts involve in security analysis with the aim of determining the value of such assets within a given portfolio (Bhat, 2009). Based on the same concept, the following paper aims at establishing the value of stocks from capitalized companies, Exxon and Berkshire, in a given portfolio. The analysis of the two stocks in this paper is achieved through a methodology section, results, and a concluding remark. Methodology In order to accomplish the main objective of this paper, two firms with capitalized stocks were selected: Exxon and Berkshire. The stocks of Exxon and Berkshire were the main data to be used in analysis and discussions. 10-years (from 2003 to 2013) of monthly stock price history for both Exxon and Berkshire were obtained from Yahoo Finance. Time series of monthly returns were then obtained from the time series of the monthly stock prices. On the basis of the time series of monthly returns, annualized mean return, standard deviation and correlation of the stocks were calculated. In addition, the analysis also calculated the weights on the minimum variance portfolio that consisted of the stocks from Exxon and Berkshire. Data and results were presented using tables and graphs. The data and results were used in carrying out the analysis and drawing up the conclusion. Results and Discussion The 10-years of monthly stock price history for both Exxon and Berkshire obtained from Yahoo Finance are included in Excel file attached. From the monthly stock prices, the monthly returns were established. The results of the monthly returns established from the monthly stock prices are illustrated in Figs. 1 and 2 through the use of a time series graph. Figure 1: Time series graph for Berkshire Figure 2: Time Series Graph for Exxon In addition to obtaining the returns and illustrating them in the above graphs, the calculated annualized mean return, standard deviation, and correlation of the stocks are illustrated in the following tables. Table 1: Summary of the Calculated Mean return, Standard deviation, and Correlation Berkshire Hathaway Inc. Exxon Mobil Co. E[R]_monthly 0.79% 1.11% Std_monthly 4.92% 5.15% E[R]_annual 101.98% 13.34% Std_annual 22.19% 22.69% Correlation 0.146 From the above table, the E(R) monthly for Exxon Mobil Corporation is larger than the E(R) monthly for Berkshire Hathaway Incorporation, that is, 1.11% against 0.79%. However, on the E(R) annual, Berkshire has 101.98% against Exxon’s 13.34%. In respect to the standard deviation, both the monthly and annualized mean returns are widely spread in Exxon than in Berkshire as indicated by the larger standard deviations in both case. In respect to the correlation, the correlation factor 0.146 indicates a positive, though weak relationship between the returns of Berkshire Hathaway Inc. and the returns of Exxon Mobil Corporation. The weights on the minimum variance portfolio are illustrated below. Table 2: The Weights on the Minimum Variance Portfolio w1 w2 VAR_P SD_P E[R]_P 0% 100% 5.15% 22.69% 13.34% 10% 90% 4.35% 20.86% 22.21% 20% 80% 3.73% 19.30% 31.07% 30% 70% 3.27% 18.09% 39.94% 40% 60% 2.99% 17.30% 48.80% 51.31% 48.69% 2.88% 16.98% 58.82% 50% 50% 2.89% 16.99% 57.66% 60% 40% 2.95% 17.17% 66.53% 70% 30% 3.18% 17.84% 75.39% 80% 20% 3.59% 18.95% 84.25% 90% 10% 4.17% 20.42% 93.12% 100% 0% 4.92% 22.19% 101.98% From the above table, the weights indicating the minimum variance in the portfolio are 51.31% and 48.69%. The weights on the minimum variance in the above two portfolios were calculated from the following formula: Both the standard deviation and the expected return for the minimum variance can be useful in making decisions regarding the two portfolios as discussed later. The standard deviation and the expected return for the minimum-variance portfolio can be illustrated in the following figure: Figure 3: Standard deviation and expected return for the minimum-variance portfolio Diversification of the Portfolio Risk is a fundamental concept within investments (Kevin, 2006). There are several ways of reducing the level of risks involved in an investment. One mainly used technique is diversification of portfolio. Diversification is on the basis of expected return and standard deviation of the minimum-variance portfolio (Bhat, 2009; Pandian, 2009). In the above scenario, the expected returns of the two securities differ widely. Whereas the Berkshire’s annual expected returns is 101.98% with a standard deviation of 22.19%, the annual expected return for Exxon is 13.34% with a standard deviation of 22.69%. In this case it is advisable for an investor to invest in Berkshire expecting greater returns and greater variability from Berkshire. However, for the purposes of diversifying risks, investors can invest in both the firms since they all have positive returns. In order to establish whether an investor can invest in the two stocks for purposes of diversifying risks, there is need to evaluate the expected return and standard deviation for the minimum-variance portfolio. In the above analysis, the standard deviation and expected return for the minimum-variance portfolio is 16.98% and 58.82% respectively. This implies that an investor is likely to obtain approximately 58.82% in return with a possible variations or deviations from the mean expected return of 16.98%. Conclusion Based on the above analysis, it is right and profitable for an investor to invest in the stocks or securities of the two firms. This is due to the fact that the standard deviation and expected returns for the minimum-variance portfolio indicate that such an investment will be profitable. Hence, the two stocks, Exxon and Berkshire are profitable. Section B: Mutual Funds Analysis Introduction Other than stocks or securities, mutual funds also attract investors. Nevertheless, there is need to conduct a mutual fund analysis in order to ascertain the performance before investing. Amongst the issues to look for in mutual fund analysis are the performance in respect to a given target, rewards, and risks involved (Khatri, 2010). Different tools are used in analyzing the mutual funds in a bid to identify their performance, rewards, and risks. Examples of such tools include CAPM regression, Fama-Fama regression, and use of Sharpe ratio amongst others (Avadhani, 2009; and Kumar, 2007). On the basis of the aforementioned tools, the following is an analysis of Apple Mutual Fund. The analysis includes the methodology, results, and conclusion. Methodology In order to attain the main objective of this paper, 10-years of monthly price history for a US mutual fund (Apple mutual fund) are obtained from the Yahoo Finance. The data obtained is represented in the tables as illustrated in the attached Excel file. Other than the historical monthly prices, the paper obtains the Fama-French three factors plus the risk-free rate in order to assist in the analysis. The monthly prices are then analyzed using LINEST. The LINEST function is used for running CAPM regression and Fama-Fama regression. Whereas the CAPM regression is aimed at determining the alpha and the appraisal ratio of the mutual fund, the Fama-Fama regression determines the alpha and the appraisal ratio of the mutual fund when the additional two factors of Small Minus Big and High Minus Low are taken into account. Lastly, the paper calculates the other performance measure for the mutual fund such as the Sharpe ratio. All the results obtained in this analysis are represented in tables and graphs as illustrated in the results section. Results The 10-years of monthly stock price history for Apple Mutual Fund obtained from Yahoo Finance are included in Excel file attached. From the data of the historical prices, the returns were obtained using the formula, Returns for the price = {(Adj Close – Previous Adj Close)/100}*1000 From the monthly stock prices, a graph representing the Mkt-RF series was drawn as illustrated in Fig. 4. Figure 4: Mkt-RF series graph After calculating and plotting the Returns-RF from the mutual fund against the Mkt-RF from the Fama-French mutual fund, a LINEST function in Excel was used in order to run a CAPM regression with an aim of determining the alpha and the appraisal ratio for the mutual fund. The results obtained from the function are illustrated in the following Table 3: Table 3: CAPM Regression to obtain Alpha CAPM beta alpha 0.019 0.326 0.404 1.792 R_squared 0.000 19.415 0.002 118.000 0.823 44481.361 Annual alpha 3.914 Apart from the CAPM regression through the use of LINEST function, the function was used in running the Fama-Fama type regression also to determine alpha and appraisal ration of the mutual fund whilst considering the additional two factors of Small Minus Big and High Minus Law factors. The summary of the results is provided in Table 4 below. Table 4: Fama-Fama Type Regression Fama French beta_hml beta_smb beta_m alpha -0.851 -0.886 0.386 0.531 0.797 0.878 0.478 1.798 R_squared 0.018 19.401 #N/A #N/A 0.725 116.000 #N/A #N/A 818.601 43663.583 #N/A #N/A Annual alpha 6.373 Sharpe Ratio 0.061 All the results presented in both Tables 3 and 4 can are summarized in Table 5 below. Table 5: Summary of all the Results of the LINEST Analysis Factor Value Monthly R_p-RF 0.339 Monthly SD_p 19.334 Monthly SD_Mkt-RF 4.406 Annual R_p-RF 4.064 Annual SD_p 66.975 Annual SD_Mkt-RF 15.261 Sharpe Ratio 0.061 alpha_CAPM 3.914 alpha_FF 6.373 beta_CAPM 0.019 beta_FF 0.386 Treynor_CAPM 215.237 Treynor_FF 10.520 alpha_CAPM_monthly 0.326 alpha_CAPM_annually 3.914 Non-systematic risk_CAPM 66.974 Appraisal Ratio 0.058 In Table 5 the standard deviations for both the Returns-RF and the Mkt-RF are provided as 0.339 and 4.406. On the other hand, the results indicate that the annual standard deviation for the Returns-RF and the Mkt-RF are 4.064 and 15.261 respectively. Whilst comparing the alphas, the CAPM provides an alpha of 3.914 against the FF, which provides an alpha of 6.373. In respect to the beta, the CAPM and FF provide 0.019 and 0.386 respectively. Apart from the alpha and the beta, the analysis also evaluated for Treynor. CAPM and FF provided a Treynor of 215.237 and 10.520 respectively. There is a bid range between the monthly CAPM alpha and the annual CAPM alpha, which are 0.326 and 3.914 respectively. Lastly, the analysis also established that for the non-systematic risks CAPM regression produced 66.974 whilst the appraisal ratio was obtained at 0.058. Amongst the many uses of CAPM is to analyze the performance of mutual funds as well as other portfolios (Bhat, 2009). CAPM compares historical risk-adjusted returns of a given mutual fund and the appropriate index, in this case the Fama-French mutual funds (Kevin, 2006b). In a CAPM analysis, alpha indicates the performance of a given fund against the prediction of the analysis (Elton, et. al., 2009; Reilly & Brown, 2011). In this perspective, the alpha values are negative hence indicating that the Apple mutual fund’s performance was better than the prediction of the CAPM. Notably, since CAPM uses only one factor, the addition of the Fama-French three factors was aimed at making the regression model provide a better r-squared fit for the analysis of Apple Mutual Fund (Khatri, 2010). Moreover, the three factors included in the analysis were effective on the basis of the fact that they represent the various behaviors of mutual funds (Rustagi, 2007). Consequently, this provides a better understanding of the performance of the mutual fund in question. Lastly, the Sharpe ratio included in the analysis was aimed at assisting the investors to obtain the best possible proportion of the mutual fund for the purposes of investing. Sharpe ratio is a portfolio analysis is usually regarded as a direct measure of the reward-to-risk that is evident within a given mutual fund. Conclusion Based on the above results, the alpha values indicate a positive performance from the predictions of CAPM. In addition, the Sharpe ratio provides an understanding on the reward-to-risk ratio involved in buying the Apple Mutual Funds. Given that the Sharpe ratio is low (0.061), it means that the reward and risk involved in this investment are almost at par. Therefore, a careful analysis should be considered in investing despite the fact that the alpha has indicated positive performance. Bibliography Avadhani, V. A., 2009. Securlties Analysis and Portfolio Management. Mumbai, India: Himalaya Publishing House. Bhat, S., 2009. Security Analysis & Portfolio Management. New Delhi, India: Excel Books. Elton, E. J., Gruber, M. J., Brown, S. J., & Goetzmann, W. N., 2009. Modern portfolio theory and investment analysis. New York, NY: John Wiley & Sons. Kevin, S., 2006. Security analysis and portfolio management. New Delhi, India: PHI Learning Pvt. Ltd. Kevin, S., 2006b. Portfolio Management. New Delhi, India: PHI Learning Pvt. Ltd.. Khatri, D. K., 2010. Security Analysis and Portfolio Management. London: Macmillan. Kumar, S. S. S., 2007. Financial derivatives. PHI Learning Pvt. Ltd.. Pandian, P., 2009. Security Analysis And Portfolio Management, 1E. New Delhi, India: Vikas Publishing House. Reilly, F. K. F. K. R., & Brown, K. C., 2011. Investment Analysis and Portfolio Management (with Thomson One-Business School Edition and Stock-Trak Coupon). Boston, MA: South-Western Pub. Rustagi, R. P., 2007. Investment analysis and portfolio management. New Delhi, India: Sultan Chand & Sons, New Delhi, 459-596.s Read More
Cite this document
  • APA
  • MLA
  • CHICAGO
(“Security Analysis and Portfolio Management Essay - 2”, n.d.)
Security Analysis and Portfolio Management Essay - 2. Retrieved from https://studentshare.org/finance-accounting/1620302-security-analysis-and-portfolio-management
(Security Analysis and Portfolio Management Essay - 2)
Security Analysis and Portfolio Management Essay - 2. https://studentshare.org/finance-accounting/1620302-security-analysis-and-portfolio-management.
“Security Analysis and Portfolio Management Essay - 2”, n.d. https://studentshare.org/finance-accounting/1620302-security-analysis-and-portfolio-management.
  • Cited: 0 times

CHECK THESE SAMPLES OF Stocks from Companies: Exxon and Berkshire

Legal Issues of Company Directors Remuneration

The companies Act 1985 defines many of the provisions about the directors' remuneration.... Section 741 of the companies Act (CA) 1985 defines the term director: any person occupying the position of director, by whatever name that position occupying person is called (Corporate and business law (UK), exam kit, 2007/08)....
6 Pages (1500 words) Assignment

Behaviors of Stock Markets

Principal-agent incentives, excess caution, and market inefficiency evidence from utility regulation) Weak form efficiency In a weak-form efficient market share prices reflects information about all the past prices movements.... In an inefficient market, some stocks will be overpriced and others will be underpriced, which means some investors can make excess while other can lose more than warranted by their level of exposure.... The logic behind this process is that proper valuation of securities and stocks depends upon the latest information and in an inefficient market no latest data about the stock and securities are available....
7 Pages (1750 words) Essay

Insider Trading by Directors

For testing, data was extracted from the New York Stock and NASDAQ of fifty randomly selected companies.... The insider trading information of these companies for the financial period January 1, 2009 until June 30, 2012 was analyzed.... Although anybody from inside the corporations can commit insider trading, however directors have always remained the pioneer of doing so....
53 Pages (13250 words) Dissertation

Finance and Accounting: Practical and Written Assessment

The ROIC can be calculated by subtracting dividends from net income and dividing it by the total capital.... As it has been discussed that Porsche incorporated pioneering strategies and business decisions embedded with technology and capital for Cayenne and Boxster, which was evident from the sales figures....
14 Pages (3500 words) Assignment

Search for Synergies in Business Realistic or Not

In business, the term describes a hoped-for or real effect resulting from different individuals, departments, or processes or portfolios of a business or companies working together and bringing about higher productivity and revenues than those of the sum of the individual elements or processes or portfolios of the business.... This kind of advantage may be derived from the combined or cooperative efforts of different lines of business of an enterprise and or from the merger of two companies in the same line of business or industry....
8 Pages (2000 words) Essay

Clustering Stock Market Companies and Finding Relationships through Corporations

The essay "Clustering Stock Market companies and Finding Relationships through Corporations" focuses on the critical, and thorough analysis of the major issues concerning clustering stock market companies and finding relationships through corporations.... Not only are clusters more successful in terms of profitability and growth indicators but they are also well-positioned in terms of good management structures and high share value concerning the companies who are not clustered....
30 Pages (7500 words) Essay

Accounting Ethical Issues of American International Group

In addition, AIG group companies are leading providers of retirement services, financial services, Auto Insurance, Health Insurance and asset management around the world.... Subsequently the company took corrective measures and fortunately for investors, employees and other stakeholders in many countries, continues to conduct all its operations smoothly, unlike ENRON, WorldCom and some other companies.... While these companies appeared to have had flawed business models and hid the real and rapidly deteriorating financial conditions, at AIG it appears to have taken place on account of some wrong practices....
6 Pages (1500 words) Case Study

Risks Associated by Sources of Finance in China

Financial statements provide comprehensive information about the reporting entity that is useful to exist and potential stakeholders': DiscussionThe financial statements prepared by the companies are reported with comprehensive data and information on the reporting entities.... The shareholders may be classified into existing and potential investors who track the financial statements reported by the companies as a reliable means of measuring the performance of the company (Briloff, 1981, p....
8 Pages (2000 words) Literature review
sponsored ads
We use cookies to create the best experience for you. Keep on browsing if you are OK with that, or find out how to manage cookies.
Contact Us