StudentShare
Contact Us
Sign In / Sign Up for FREE
Search
Go to advanced search...
Free

Financial Reporting and Analysis - Blacksea Plc - Literature review Example

Cite this document
Summary
From the paper "Financial Reporting and Analysis - Blacksea Plc" it is clear that generally, Blacksea’s performance has been effective in all respects. They have been profitable, liquid and also efficient. They have very low debt to satisfy their shareholders…
Download full paper File format: .doc, available for editing
GRAB THE BEST PAPER95% of users find it useful
Financial Reporting and Analysis - Blacksea Plc
Read Text Preview

Extract of sample "Financial Reporting and Analysis - Blacksea Plc"

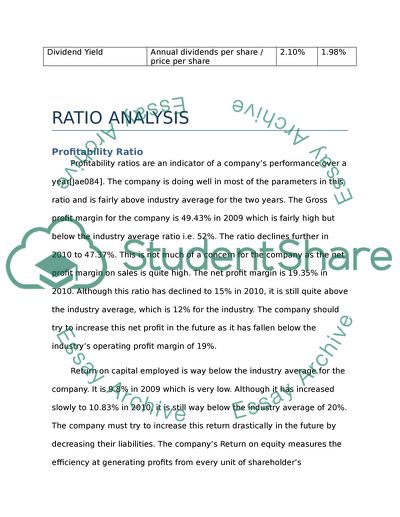
BLACKSEA PLC FORMULA YEAR 2009 Profitability Ratios Return on Capital Employed EBIT Total assets – current liabilities) 9.80% 10.83% NetProfit margin Net profit / sales 19.35% 15.00% Gross profit margin Gross profit / sales 49.43% 47.37% Return on equity Net income / shareholder’s equity 5.27% 6.12% Return on assets Net income / total assets 8.86% 9.89% Turnover to capital Employed Turnover / Equity shareholders fund 0.51times 0.72times Liquidity Ratios Current Ratio Current asset / current liability 1.46 2.73 Quick Ratio (Current asset – inventory) / current liability 0.39 1.23 Inventory turnover period 365 / inventory turnover period 161days 137days Inventory turnover rate Cost of sales / inventory 2.26times 2.67times Accounts receivables collection Annual sales / receivables 30days 40days Accounts payable payment Annual sales / payables 100days 70days Efficiency Ratios Asset turnover ratio Sales / total assets 0.51times 0.72times Operating Ratios Gearing % Total equity / total liability 0% 9.5% Interest cover EBIT / interest expense 0 12.67 Shareholder’s Ratio Total shareholder equity / total assets 1 0.91 investment Ratios Earnings per share (net income – dividends on preferred stock) / average outstanding shares 9pence 11pence Price/earnings ratio Market value per share / earnings per share 15.11 12.91 Dividend cover Net income / dividend paid 3.2 3.89 Dividend Yield Annual dividends per share / price per share 2.10% 1.98% RATIO ANALYSIS Profitability Ratio Profitability ratios are an indicator of a company’s performance over a year (SHIM, Jae K. and Siegel, Joel G., 2008). The company is doing well in most of the parameters in this ratio and is fairly above industry average for the two years. The Gross profit margin for the company is 49.43% in 2009 which is fairly high but below the industry average ratio i.e. 52%. The ratio declines further in 2010 to 47.37%. This is not much of a concern for the company as the net profit margin on sales is quite high. The net profit margin is 19.35% in 2010. Although this ratio has declined to 15% in 2010, it is still quite above the industry average, which is 12% for the industry. The company should try to increase this net profit in the future as it has fallen below the industry’s operating profit margin of 19%. Return on capital employed is way below the industry average for the company. It is 9.8% in 2009 which is very low. Although it has increased slowly to 10.83% in 2010, it is still way below the industry average of 20%. The company must try to increase this return drastically in the future by decreasing their liabilities. The company’s Return on equity measures the efficiency at generating profits from every unit of shareholder’s equity (BRIGHAM, Eugene F. and Ehrhardt, Michael C., 2010). The company’s Return on equity shows how well a company uses investment funds to generate earnings growth (CORREIA, Carlos et al., 2007). And the company’s Return on equity has increased from 2009-2010 from 5.27%-6.12% which is a very good sign but it is still on the low side. The Company’s return on the asset is neither too high nor too low. It is 8.86% in 2009 and has just increased slightly to 9.89% in 2010. Although, an increase is a good sign but the company must try and further increase this ratio in the ratio by decreasing their asset usage and to increase their net profit even further. Liquidity Ratios Liquidity ratios illustrate the company’s ability to pay off obligations in the short term (CHANDRA, Prasanna, 2008). Current asset ratio and acid-test ratio are observed closely when liquidity is in question. The company is in a fairly good position in both of these parameters. The current ratio of the company has increased drastically from 1.46 in 2009 to 2.73 in 2010. In 2010 it is above the industry average of 2.5 which is a good sign for the company. It shows that a fair amount of assets are available to finance the liabilities of the company and that a company can pay off its short term liabilities quite easily. The Quick ratio for the company shows that current assets are not dependent on inventory (JAIN, Khan &, 2007). It has increased drastically above the industry average of 1.1. It has increased to 1.23 in 2010 from just 0.39 in 2009. It suggests that there is very little stock in inventory and fair amount of liquid cash is available to the company. This also suggests that company is capable of paying off its obligations. Inventory turnover period for the company has decreased significantly from 161 days in 2009 to 137 days in 2010; this suggests that our sales have increased in 2010. It, along with quick ratio, also shows that the stock is not accumulated in inventories. This means that our inventory turnover rate has increased to 2.67 from 2.26 which are quite good for the company. Accounts receivables collection for the company is well within the average for the industry which shows the company is able to collect payments made on credit quite easily (MCKINSEY, James Oscar and Frazer, George Enfield, 1922). It is only 30 days in 2009. Although it has increased to 40 days in 2010, it is still below the average which is 69 days for the industry. It is also not a cause of worry as the company has a fair amount of cash on hand to finance its liabilities. Accounts payable has also decreased quite drastically in 2010 to 70 days from 100 days in 2009. It is again due to the fair amount of sales during the year. The company must try and further decrease this payment period to maintain its good reputation in the future. Efficiency Ratios Efficiency Ratios are typically used to analyze how well a company uses its assets and liabilities internally (FABOZZI, Frank J. et al., 2003). Asset turnover ratio is the most common ratio when it comes to efficiency ratio. It tells how well the company is managing its assets. The asset turnover ratio for the company is on a very low side. Although the sale of the company is quite good but due to the high assets of the company, turnover is low. The asset turnover ratio in 2009 was only 0.51 times for the sale; it increases only slightly to reach 0.72 times in 2010. The turnover ratio for the company is way below the industry average of 1.6. The company must try to use its assets effectively in the future to get this ratio in comparison to the industry average. Operating Ratios Operating Ratios describe financial ratios that compare some form of owners equity (or capital) to borrow funds (TAPIERO, Charles S., 2004). Gearing is a measure of financial leverage, demonstrating the degree to which firms activities are funded by owners funds versus creditors funds. The company’s gearing ratios are magnificently on the low side which is excellent for the company. In 2009, the debt to equity ratio for the company was 0% which means that there were no borrowings by the company during the year. Although this ratio increases to 9.5% in 2010, it is still well within theparameters of industry average of 30%. It means that alot of equity is available for the company to finance the assets. As there are no borrowings by the company in 2009, the interest cover for the company is also 0 during 2009. This ratio increases to 12.67 in 2010 which is just slightly above the industry average but is within the paying capability. The high ratio suggests that the company can easily pay interest on outstanding debt as it is not too high. The company is generating sufficient revenue to satisfy its interest expense. The shareholder ratio is another parameter in operating ratio which is excellent for the company (STOLTZ, André, 2007). In 2009 it was 1 to the total assets, which suggests that in case of liquidation, the shareholders will receive all the assets owned by the company. Even in 2010, it was 0.91 which means the shareholders will still get more than 90% of the total assets in case of liquidation. Investment Ratio Investment ratios are used by the investors to make a potential investment decision in the company (BAKER, Harold Kent and Powell, Gary E., 2005). The main ratios are the earning per share, price per equity ratio, dividend cover and dividend yield. Earning per share for the company is the same as industry average during 2009 i.e. 9 pence and increases to 11 pence in 2010. Earnings per share serves as an indicator for company’s profitability and thus shows that company’s profitability has increased from 2009 to 2010. Price/earnings ratio for the company is also quite impressive with a staggering price of 15.11 per earnings in 2009. Although it drops down to 12.91 in 2010, it is still above the industry average of a price of 11 per earnings. It suggests that the company is expecting a higher earnings growth in the future. Dividend cover for the company is not on the bright side. It is 3.2 times per dividend paid to shareholders in 2009 and increases just slightly to 3.89 times in 2010. However, it is still above the industry average of 2.5 for the two years. The company must try and further increase this ratio in the future. The dividend yield for the company is also quite low suggesting that the company pays only a little in dividends relative to its share price. It is 2.10% in 2009 and decreases further to 1.98% in 2010. The company must try and increase this ratio so that investors invest in the company. Company Analysis The ratio analysis shows that company is strong financially and is performing well. The profitability ratios show that the sales and profit are good. The company must draft policies to continue this stability and to maintain profit. The market price per share is strong and it thus attracts investors towards the company. Price earnings ratio for the company is also quite high which attracts new investors towards the company. It is evident by our analysis that the company is looking forward to repay its debts quickly and they have been successful in doing it. As of 2010, the company has fair amount of cash in hand even after paying to creditors, their stock is not accumulated in inventory and sales are on a positive side. They have performed well in the past two years by taking strategic decisions and will continue to do so in future. In conclusion, Blacksea’s performance has been effective in all respects. They have been profitable, liquid and also efficient. They have very low debt to satisfy their shareholders. Analysts have recommended it to be buy-stock Company which is complimented by our analysis as well. They have focused more on creating value and have complimented their culture with innovations every now and then. They are practicing all pre-requisites to become the leader in the industry. Works Cited BAKER, Harold Kent and Gary E. POWELL. 2005. Understanding financial management: a practical guide. John Wiley & Sons. BRIGHAM, Eugene F. and Michael C. EHRHARDT. 2010. Financial Management Theory and Practice. Cengage Learning. CHANDRA, Prasanna. 2008. Financial Management. Tata McGraw-Hill Education. CORREIA, Carlos, David FLYNN, Enrico ULIANA, and Michael WORMALD. 2007. Financial Management. Juta and Company Ltd. FABOZZI, Frank J., Pamela P. PETERSON, and Pamela Peterson DRAKE. 2003. Financial management and analysis. John Wiley and Sons. JAIN, Khan &. 2007. Financial Management. Tata McGraw-Hill Education. MCKINSEY, James Oscar and George Enfield FRAZER. 1922. Financial management: an outline of its principles and problems. American School. SHIM, Jae K. and Joel G. SIEGEL. 2008. Financial Management. Barrons Educational Series. STOLTZ, André. 2007. Financial management. Pearson South Africa. TAPIERO, Charles S. 2004. Risk and financial management: mathematical and computational methods. John Wiley and Sons. Read More
Cite this document
  • APA
  • MLA
  • CHICAGO
(“Financial Reporting and Analysis Literature review”, n.d.)
Financial Reporting and Analysis Literature review. Retrieved from https://studentshare.org/finance-accounting/1587239-financial-reporting-and-analysis
(Financial Reporting and Analysis Literature Review)
Financial Reporting and Analysis Literature Review. https://studentshare.org/finance-accounting/1587239-financial-reporting-and-analysis.
“Financial Reporting and Analysis Literature Review”, n.d. https://studentshare.org/finance-accounting/1587239-financial-reporting-and-analysis.
  • Cited: 0 times

CHECK THESE SAMPLES OF Financial Reporting and Analysis - Blacksea Plc

The Effects of Globalization on Cadbury Schweppes

However, gearing ratios can be both good and bad and therefore cannot really reveal much about a company's financial constructs.... The paper "The Effects of Globalization on Cadbury Schweppes" states that the SWOT and PESTLE analyses demonstrate that the maximisation of shareholder value was largely pursued via brand creation and protection and the continued diversification and expansion of business globally....
29 Pages (7250 words) Dissertation

Asylum in the Media

Speculations among the people on the number of asylum seekers who have been allowed refugee status left a lot to be desired when a survey conducted in 2009, which revealed that more than 100,000 of asylum seekers had been accepted as refugees with clear and credible sources reporting that only 4,175 people had been received as refugees....
18 Pages (4500 words) Essay

Management Accounting for Cadbury Schweppes plc

This paper seeks to analyse the information needs Cadbury Schweppes plc for the purpose of determining the use and application of management accounting methods and techniques.... The following are the chosen methods or techniques: Budgeting, Variance analysis, Absorption Based Costing and Cost Volume Profit analysis.... The following are the chosen methods or techniques: Budgeting, Variance analysis, Absorption Based Costing and Cost Volume Profit analysis....
8 Pages (2000 words) Case Study

Blacks Leisure Group, plc

In the paper 'Blacks Leisure Group, plc' the author analyses one of the United Kingdom's leading sportswear and sporting goods retailers and is the market's largest specialty outdoor retailer.... The company's strength lies in its recognition that outdoor activities are not only confined to adult men....
2 Pages (500 words) Essay

Comparative analysis of food retailers growth strategies in the UK

The market structure comprises of few firms that are relatively large and has significant barriers of entry due to the large economies of scale of the.... ... ... Some of the large firms like Tesco and Wal-Mart have command market share, and influence over the prices of the products and consider the rival reactions while setting up the food prices (Burt & Leigh, 2003, p 25)....
10 Pages (2500 words) Research Paper

A Change in the Company's Balance Sheet

Blacks Leisure Group, plc is a clothing wholesaler and retailer based in the UK.... This report aims to probe the company financial health by looking at its financial statement and conducting ratio analysis in order to see the underlying relationships of the financial statement items.... These not favorable financial figures signify a lot of problems that the company needs to address in order to regain its financial health....
12 Pages (3000 words) Assignment

The UK Fashion Industry

ll these contribute towards the selection of the fashion industry for analysis.... Among many reasons, high-in fashion brands' quest is a leading one (Deloitte.... 2014).... UK shows highest growth in the sector among all EU countries in 2013 as presented below. ... ... urther the industry is....
9 Pages (2250 words) Research Paper

Competition and Performance of the UK Apparel Retailer Sector

The environment of the apparel industry has been assessed in terms of performance and competition by evaluating three important market players, namely, Moss Bros Group plc, JD Sports Fashion plc and Sports Direct International plc.... PEST, Porter's Five Force analysis and SWOT analysis have been performed to study the external environment while ratio analysis was considered appropriate for internal assessment....
32 Pages (8000 words) Research Paper
sponsored ads
We use cookies to create the best experience for you. Keep on browsing if you are OK with that, or find out how to manage cookies.
Contact Us