StudentShare
Contact Us
Sign In / Sign Up for FREE
Search
Go to advanced search...
Free
Premium+

Technical Analysis for Royal Dutch Shell Oil Vs Exxonmobil - Report Example

Cite this document
Summary
Within this report the conducts a concise fundamental as well as technical analysis for RSD-B (Royal Dutch Shell Oil) vs. XOM (ExxonMobil). This report will recommend with credible references and analysis the best choice amongst the two stocks…
Download full paper File format: .doc, available for editing
GRAB THE BEST PAPER97.5% of users find it useful
Technical Analysis for Royal Dutch Shell Oil Vs Exxonmobil
Read Text Preview

Extract of sample "Technical Analysis for Royal Dutch Shell Oil Vs Exxonmobil"

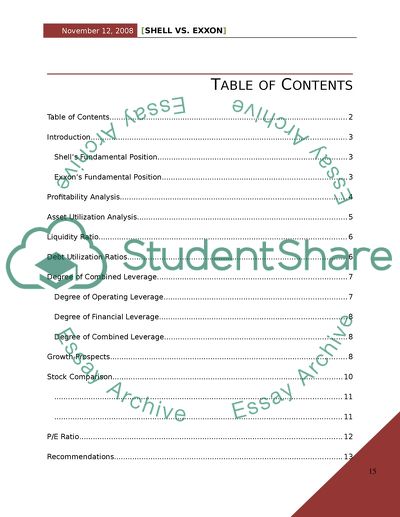
Shell vs. Exxon Within this report the conducts a concise fundamental as well as technical analysis for RSD-B (Royal Dutch Shell Oil) vs. XOM (ExxonMobil). This report will recommend with credible references and analysis the best choice amongst the two stocks. Table of Contents Table of Contents 2 Introduction 3 Shell’s Fundamental Position 3 Exxon’s Fundamental Position 3 Profitability Analysis 4 Asset Utilization Analysis 4 Liquidity Ratio 5 Debt Utilization Ratios 6 Degree of Combined Leverage 7 Degree of Operating Leverage 7 Degree of Financial Leverage 7 Degree of Combined Leverage 8 Growth Prospects 8 Stock Comparison 10 11 11 P/E Ratio 12 Recommendations 13 Works Cited 14 Bibliography 15 Introduction Undeniably the Royal Dutch Shell Plc and ExxonMobil are insuperably brand names, each of these companies holds a very high position amongst market capitalization on the respective indices, very respectively these companies also have successfully been able to generate faith amongst their shareholders in these troubled times. Current Oil Prices in the market help these companies further in terms of expansion, as now they can purchase raw crude at more than 50 % discounted rates than the life time high of the commodity. Shell’s Fundamental Position Shell Oil Company is the American associate of Royal Dutch Shell, which is amongst the largest Oil suppliers of the world. The following facts make shell a fundamentally strong company: 25,000 Shell brand Gas Stations across the United States. 50% stake owned in the Saudi Arab govt. company Saudi Armco. 80 % stake in exploration company Pectan. Supplies to Texaco Stations. Subsidiaries: Aera Energy LLC, Shell Development Emeryville, and Motiva Enterprises. Exxon’s Fundamental Position Similar to Shell, Exxon is also a heavyweight within the indices. The following factors make Exxon a fundamentally strong company: World’s largest company in terms of revenues. Largest Public Corporation. Produces a total of 3% of world’s total Oil demand. Considering the above their remains no doubt about the fundamentally strongest company, not only amongst Shall & Exxon, but amongst all of its competitors in the U.S. Profitability Analysis As it is eminent through Figure 1, that return on assets as well as equity for ExxonMobil is much higher as compared to Shell’s, this is undoubtedly due to the fact that Shell’s profit margins are not even half of what Exxon earns. But the author also considers the fact that 11.80 % is not the half of 17.00 % which Exxon was able to attain. Ratio Profit Margin 15.3 % 36.00 % Return on Assets 11.80 % 17.00 % Return on Equity 13.20 % 22.00 % Figure 1 Profitability (Year 2007) Therefore, the author also places the argument that Shell might prove to be a better utilizer of funds as compared to Exxon. This shall be further discussed with other ratios. Asset Utilization Analysis Ratio Receivable Days 76 33 Average Collection Period 93 83 Inventory Turnover 39 20 Fixed Asset Turnover 2.31 2.59 Total Asset Turnover 1.14 1.6 Figure 2 Asset Utilization (year 2007) XOM: (REUTERS, 2008) SHELL: (REUTERS, 2008) (ADVFN Financials, 2008) It is to be noted that the figures above only concern the year ending 2007, considering the fact that Exxon Mobil surpasses Shell in every manner here except for ‘Fixed Asset Turnover’, also considering that Exxon is a fundamentally stronger company than Shell the ‘fixed asset turnover’ wouldn’t be much of a hurdle. Although the author would like to place in some several very important facts here: The receivable days for Shell have decreased since the year 2005, when they were 79; but the receivable days for Exxon have increased from 27 to 33. Which is not a good sign for the company, but then again, there exist tremendous difference between the numbers 33 – 76. It seems Shell still has a long way to go. Similarly Shell has been able to decrease their credit period from 100 days in 2005 to just 93, as compared to Exxon’s which was 71 in 2005 and has increased to 83, so Shell is quite close on this one. Liquidity Ratio Ratio Current Ratio 1.22 % 1.47 % Quick Ratio 0.88 % 1.28 % Figure 3 Liquidity (YEAR 2007) (ADVFN Financials, 2008) It appears that Shell has conquered the liability / asset battle. Shell is officially ahead of Exxon on both the patterns of Liquidities, but not by far. Especially on the current ratio part which matters the most. Debt Utilization Ratios Ratio Debt to Total Equity 0.12 0.08 Interest Coverage Ratio 89.0 130.02 Figure 4 Debt Utilization (REUTERS, 2008) (ADVFN Financials, 2008) Both the company’s are superbly maintaining their debt to equity ratios, as a matter of fact, if these figures go beyond this, the companies might set a new record and an example for other corporations; even attracting their jealousy. But considering their fundamentally sound position, this was eminent. Although, Exxon’s lead on Interest Coverage might prove to be a factor while considering dividends, as it processes out maximum dividends based on its Interest Coverage capabilities. Degree of Combined Leverage The return on equity and return on assets for shell is quite lower than its counterpart Exxon, Shell is ultimately carrying a much higher load of debt on its shoulders. Thus we have conducted the following analysis: Degree of Operating Leverage Revenues 355,782,000 404,552,000 COGS 285,229,000 232,852,000 SG&A 16,621,000 14,890,000 DOL = (R – COGS)/(R – COGS – SG&A) 1.31 1.09 Figure 5 Operating Lev. (Pratt & Niculita, 2007) Degree of Financial Leverage EBIT 51,144,000 71,879,000 I 31,331,000 40,610,000 DFL = EBIT / (EBIT – I) 2.58 2.29 Figure 6 Financial Lev. (Pratt & Niculita, 2007) Degree of Combined Leverage DCL = (R – COGS) / (R – COGS – SG&A – I) 3.12 1.47 Figure 7 COMBINED (Pratt & Niculita, 2007) These have helped us determine the future prospects for the companies as revenues of a company are the most important factor to be correlated while a purchase. Growth Prospects 2004 2005 2006 2007 Net income 18,183,000 25,311,000 25,442,000 31,331,000 Growth (%) 39.20 % 0.51 % 23.15 % Total Growth in 4 years 72.30 % Figure 8 GROWTH PROSPECTS SHELL (REUTERS, 2008) (ADVFN Financials, 2008) 2004 2005 2006 2007 Net income 25,330,000 36,130,000 39,500,000 40,610,000 Growth (%) 42.63 % 9.32 % 2.81 % Total Growth in 4 years 60.32 % Figure 9 GROWTH PROSPECTS XOM (REUTERS, 2008) (ADVFN Financials, 2008) 2007 Net Income 31,331,000 Estimated 4 yr growth rate 72 % Estimated 2011 Net Income 53,889,320 2007 Net Income 40,610,000 Estimated 4 yr growth rate 60 % Estimated 2011 Net Income 64,976,000 As one may have noticed from the Growth Prospects of the company Figure 8 & 9, that Shell has been able to recover from the possible slowdown of the year 2006 with astonishing growth figures of 23 % in the year 2007, although it is advised that the investor shall wait for further results in 2008 to clarify the position further and help analyze the situation better. This factor alone has helped prove the fact that Shell can handle downtrends better than its competitors. (REUTERS, 2008) Based on our research it is eminent that Shell has recovered from the downtrend at a much faster pace as compared to not only Exxon but other rivals too. (Pratt & Niculita, 2007) But still Shell’s the 4 year average is quite lower, and if we consider that Exxon’s return for 2007 would be comparable to that of Shell’s, Exxon’s return would have been greater than 88 %, which is not a bad return considering the fact that no investment since 2005 have been able to churn out such returns. Stock Comparison Figure 10 SHELLs Chart 2007 (Yahoo! Finance, 2008) Figure 11 Exxons CHART 2007 (Yahoo! Finance, 2008) P/E Ratio 2005 2006 2007 EPS 3.79 3.97 5.00 Stock price 64.53 71.15 83.13 P/E Ratio 17.02 17.92 16.62 2005 2006 2007 EPS 5.76 6.68 7.36 Stock price 56.17 76.63 92.08 P/E Ratio 9.75 11.47 12.51 P/E ratio helps in calculating the risk involved in the deal, and is a superb tool for the purpose of comparison with rivals in the same sector. It is highly applicable in order to judge the Stop-Loss positions. Recommendations Considering the fact that Shell is growing at a higher pace than its rival Exxon. And if the growth rates continue, Shell can be the market leader within just a couple of decades. But still based on the research conducted until now it is eminent that Shell can in fact prove itself to be a better company, as even though it is much shorter than Exxon in terms of Market Capitalization and particularly ‘Profit Margins’ it has proved itself to be a worthy competitor. Shell is not only the winner company fundamentally, but technically too, as the chart and price indicators suggest so. Thus the author recommends shell as a better investment. Works Cited ADVFN Financials. (2008, November 12). Exxon Mobil Comany: ADVFN. Retrieved November 12, 2008, from advfn.com: http://in.advfn.com/p.php?pid=financials&symbol=NYSE%3AXOM ExxonMobil. (2008, November 06). Exxon Mobil Corporation. Retrieved November 12, 2008, from exxonmobil.com: http://www.exxonmobil.com/corporate/ Pratt, S. P., & Niculita, A. V. (2007). Valuing a Business: The Analysis and Appraisal of Closely Held Companies. Washington: McGraw-Hill Professional. REUTERS. (2008, November 12). Shells Info: Reuters. Retrieved November 12, 2008, from Reuters: http://www.reuters.com/finance/stocks/ratios?symbol=RDSa.N&rpc=66 REUTERS. (2008, November 12). XOM Info: Reuters. Retrieved November 12, 2008, from Reuters: http://www.reuters.com/finance/stocks/ratios?symbol=XOM.N&rpc=66 Shell . (2008, September 08). Shell Oil Company. Retrieved November 12, 2008, from shell.com: http://www.shell.com/ Yahoo! Finance. (2008, November 12). RDS-B Chart. Retrieved November 12, 2008, from finance.yahoo.com: http://finance.yahoo.com/echarts?s=RDS-B#chart8:symbol=rds-b;range=5y;indicator=volume;charttype=line;crosshair=on;ohlcvalues=0;logscale=on;source=undefined Yahoo! Finance. (2008, November 12). XOM - Chart. Retrieved November 12, 2008, from finance.yahoo.com: http://finance.yahoo.com/echarts?s=XOM#chart6:symbol=xom;range=5y;indicator=volume;charttype=line;crosshair=on;ohlcvalues=0;logscale=on;source=undefined Bibliography Pratt, S. P., & Niculita, A. V. (2007). Valuing a Business: The Analysis and Appraisal of Closely Held Companies. Washington: McGraw-Hill Professional. Read More
Cite this document
  • APA
  • MLA
  • CHICAGO
(Technical Analysis for Royal Dutch Shell Oil Vs Exxonmobil Report Example | Topics and Well Written Essays - 3000 words, n.d.)
Technical Analysis for Royal Dutch Shell Oil Vs Exxonmobil Report Example | Topics and Well Written Essays - 3000 words. https://studentshare.org/finance-accounting/1549573-finance-analysis
(Technical Analysis for Royal Dutch Shell Oil Vs Exxonmobil Report Example | Topics and Well Written Essays - 3000 Words)
Technical Analysis for Royal Dutch Shell Oil Vs Exxonmobil Report Example | Topics and Well Written Essays - 3000 Words. https://studentshare.org/finance-accounting/1549573-finance-analysis.
“Technical Analysis for Royal Dutch Shell Oil Vs Exxonmobil Report Example | Topics and Well Written Essays - 3000 Words”. https://studentshare.org/finance-accounting/1549573-finance-analysis.
  • Cited: 0 times

CHECK THESE SAMPLES OF Technical Analysis for Royal Dutch Shell Oil Vs Exxonmobil

ExxonMobil Corporation

Over the last 125 years exxonmobil has evolved from a regional marketer of kerosene in the U.... hellip; exxonmobil is the world's largest nongovernmental producer of oil and gas, marketer of natural gas and one of the world's largest refiners, with 6.... million barrels a day of crude oil capacity in 45 refineries in 25 countries.... The company is a leading producer of many primary petrochemicals and sells about 28 million tons of petrochemicals per year in more than 150 countries. The modern history of the US oil and gas industry began in the latter half of the 19th century with the first commercial oil drilling venture in Pennsylvania....
16 Pages (4000 words) Research Paper

Royal Dutch/Shell Group

This would be achieved through active portfolio management, personal accountability, operational excellence, and cost leadership" (royal dutch/Shell Group, 2008, pg.... Growth in profits, cash generation, and a shift towards gas being the fuel of choice would be a large part of this venture which was to take place during the key time frame that was brought into question by the case study (royal dutch/Shell Group, 2008 and Kim, Park, and Prescott, 2003).... During the 1950's and 1960's, Shell was supplying one-seventh of the world's oil, made discoveries of major oil reserves, and saw natural gas beginning to become one of the world's leading alternative fuels, which spiked in the 1970's....
10 Pages (2500 words) Essay

Shipping Sector and Second-hand LNG Ships

In this research essay, the reporter deliberates why second-hand LNG ships should be acquired by evaluating its technical and economical strategies in detail.... here are about 346 LNG carriers presently involved in LNG business on the international level.... nbsp; … The majority component of LNG is Methane and natural gas is chilled to minus 2600 F and kept in a fluid state at approximately three and halt psig in isolated tanks....
19 Pages (4750 words) Essay

The Application of Major HSE Guidelines Into the Business Operations of Oil and Gas Companies

In this paper, we examine the application of HSE in the oil and gas industry.... Health, Safety, and Environment in the oil and gas industry focus on the development, implementation, and improvement of HSE management systems.... As such, BMS Consultancy (2009) reiterates that, firstly, maintaining health and safety standards in business facilities in oil and gas companies involves the inspection of refinery, depot, and gasoline station facilities, and testing of chemicals that come from refinery operations for toxicity and explosion capacities....
11 Pages (2750 words) Essay

ExxonMobil Research and Engineering

This paper "exxonmobil Research and Engineering" focuses on the fact that Exxon Mobil is an American company that ventures in oil and gas exploration.... The importance of this SWOT analysis is to identify whether it is a wise venture to invest in exxonmobil.... To effectively explain the strengths of the organization, this paper highlights the following issues in regard to exxonmobil, its position as the most dominant player in its field of operation, and its varied sources of revenue....
12 Pages (3000 words) Case Study

Analysis Of The Royal Dutch Shell

The main objective of the essay "Analysis Of The royal dutch shell" is to provide an analysis of the external and internal environment of the MNCs and the financial as well as operational strategies they are required to undertake to strive in the competitive market.... The cases of oil spillage are the serious issue and also the shift of the consumers demand towards cleaner technologies to reduce pollution is a serious problem.... The threats faced by Shell are mainly oil price fluctuations in the global market, high competition, product substitution and stringent governmental rules and regulations regarding environmental concerns....
10 Pages (2500 words) Essay

Lowering Gas and Oil Prices Will Assist in Stimulating the Economy

"Lowering Gas and oil Prices Will Assist in Stimulating the Economy" paper examines in detail the reasons for this process.... They start from disincentives to production caused by the fall in oil prices to the amount of investment that is needed for exploration, extraction, and transportation.... Given the deep linkages that exist between these stages of the production cycle, this paper argues that higher oil prices may not be a bad thing after all....
6 Pages (1500 words) Coursework

Time for Innovation in the Oil Industry

The paper “Time for Innovation in the Oil Industry” focuses on the strategy applied by the companies operating in the oil industry with the focus on royal dutch shell Plc.... Therefore, the already established companies such as the royal dutch shell have no reason to worry about the threat of the new entrants.... In the royal dutch shell plc's case, a solid foundation against the threats of new entrants was established through leveraging of the company's reputation....
14 Pages (3500 words) Dissertation
sponsored ads
We use cookies to create the best experience for you. Keep on browsing if you are OK with that, or find out how to manage cookies.
Contact Us