StudentShare
Contact Us
Sign In / Sign Up for FREE
Search
Go to advanced search...
Free

The Financial Position and Performance of the Lafarge Company - Case Study Example

Cite this document
Summary
This paper provides an insight into the financial position and performance of the company Lafarge belonging to the building and construction industry with the help of the company’s financial statements. This purpose is met through the use of horizontal and trend analysis of the income statement. …
Download full paper File format: .doc, available for editing
GRAB THE BEST PAPER96.4% of users find it useful
The Financial Position and Performance of the Lafarge Company
Read Text Preview

Extract of sample "The Financial Position and Performance of the Lafarge Company"

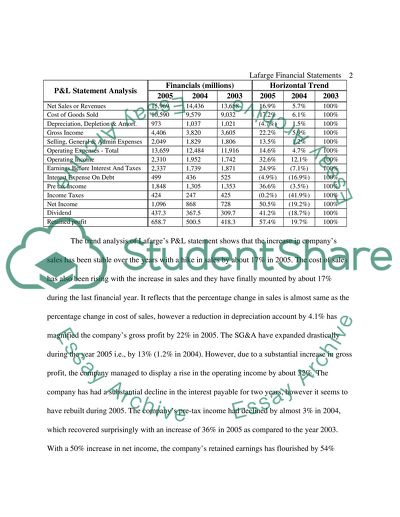
Introduction- Lafarge Financial ments This report provides an insight into the financial position and performance of the company Lafarge belonging to the building and construction industry with the help of the company's financial statements. This purpose is met in this report through the use of various tool and techniques of financial statement analysis including horizontal and trend analysis of income statement and cash flow statement plus ratio analysis, sales, EPS and EBITDA analysis. The report has been designed to provide a thorough understanding of the company's financial position and performance. Three-Year Profit And Loss Analysis The following three-year profit and loss analysis has been done with the help of the 'horizontal and trend analysis'. According to Flamholtz (1986), the horizontal and trend analysis techniques are used to assess and evaluate the percentage changes occurred in various items of a company's financial statements year on year. The trend analysis of Lafarge's P&L statement shows that the increase in company's sales has been stable over the years with a hike in sales by about 17% in 2005. The cost of sales has also been rising with the increase in sales and they have finally mounted by about 17% during the last financial year. It reflects that the percentage change in sales is almost same as the percentage change in cost of sales, however a reduction in depreciation account by 4.1% has magnified the company's gross profit by 22% in 2005. The SG&A have expanded drastically during the year 2005 i.e., by 13% (1.2% in 2004). However, due to a substantial increase in gross profit, the company managed to display a rise in the operating income by about 32%. The company has had a substantial decline in the interest payable for two years, however it seems to have rebuilt during 2005. The company's pre-tax income had declined by almost 3% in 2004, which recovered surprisingly with an increase of 36% in 2005 as compared to the year 2003. With a 50% increase in net income, the company's retained earnings has flourished by 54% while the dividend distributed have increased by 41%. Thus, an analysis of profit and loss suggests that the company has risen up from the decline that took place in its financial performance in 2004. Three-Year Earning Per Share Analysis EPS 2005 2004 2003 Earning Per Share 6.39 5.16 4.92 "Common shareholders and potential investors in common stock first look at a company's earning record" (Meigs & Meigs, p934, 1993). The EPS analysis of Lafarge's financial statements reflects that the company has had an increasing trend in the earnings per share for the last three years. The company's EPS increased by 4.8% in the year 2004, which further rose by almost 24% in 2005. This sudden enhancement of the company's earnings has also been evident in its P&L statement, which highlights a pleasant reform in the company's financial performance in the year 2005 owing to a drastic increase in sales revenue. EBITDA Analysis EBITDA 2005 2004 2003 Lafarge Group 14.8% 14.7% 14.2% Cement 23.3% 23.0% 23.0% Aggregates & Concrete 7.4% 7.1% 6.3% Gypsum Products 10.3% 9.6% 7.0% Roofing 6.5% 10.0% 9.4% Speciality products -285.7% -128.3% -38.7% EBITDA refers to the Earnings Before Interest, Taxation, Depreciation and Amortization. Therefore this analysis takes into account all the major costs and expenses other than the items mentioned above. The EBITDA margins presented in the above graph reflect a segregated view of the company's earnings in terms of the group as a whole and its subsidiaries (on the basis of products). The group's EBITDA margin represents a stable and subtle rise in the company's earnings, which is a sum up of its subsidiaries. Cement and A&C are also having a stable uplift in earnings, while Gypsum products section is showing a remarkable growth in terms of EBITDA. Roofing's earnings have declined in the year 2005 whereas the specialty products section has had a substantial increase in the declining state of earnings, which shows that its earnings are decreasing at a drastically increasing rate. Ratio Analysis Ratio analysis is the best tool to evaluate a company's performance and identify problems (Meigs & Meigs, 1993). The ratio analysis for last three years has been done for both the companies in order to gain good insight into their profitability, liquidity, investment, and Gearing position. Profitability Ratios 2005 2004 2003 Return On Assets 5.74 4.66 4.02 Return On Invested Capital 7.41 6.04 5.19 Cost of Goods Sold To Sales 66.32 66.35 66.13 Gross Profit Margin 27.59 26.46 26.39 Operating Profit Margin 14.47 13.52 12.75 Pre tax Margin 11.57 9.04 9.91 Net Margin 6.86 6.01 5.33 The above chart depicts Lafarge profitability ratios indicating the financial performance of the company over the last three years. The profitability analysis is imperative for various users of financial statements including the investors, creditors, management, government agencies etc. The company's return on assets ratio suggests that the company has been able to utilise its assets efficiently so as to obtain increasing profits, which improved further by about 23% in 2005. Riahi-Belkaoui (1998, p11) says that the return on capital employed ratio "indicates how efficiently the capital supplied by the common stockholders was employed within the firm". Lafarge's return on invested capital ratio has also been increasing for the last three years, showing that the firm employed the funds invested by shareholders in an efficient manner. The cost of goods sold to sales ratio suggests that the company loses about 66% of its total sales revenue every year to account for various production and distribution costs. The Gross Profit Margin Percentage evaluates the percentage of profit earned by a company on sales after the production and distribution activities (Mcmenamin, 1999). This ratio has also been increasing owing to the increase in sales. The difference between gross profit margin, operating margin, pre-tax profit margin and net profit margin indicates the amount of expenditures borne by the company from production to distribution, SG&A, operating, interests and taxes etc. In the above chart, the gross margin is 28% while the net margin is about 7%, which illuminates that the company manages to retain only 7% of its sales revenues after accounting for all the costs. Thus, all the company's profitability indicators are on their way of improvement and advancement, which in turns reflects a strong financial performance of the company for the last three years. Liquidity Ratios 2005 2004 2003 Current Ratio 1.30 1.48 1.35 Quick Ratio 0.95 1.08 0.99 Cash & Equiv % of Current Assets 24.93 26.18 27.34 Accounts Receivable - Days Held 72 68 71 Inventories - Days Held 57 55 60 Inventory to Cash - Days 129 124 131 A company's liquidity analysis is mainly done for its short-term creditors owing to its importance in exposing the company's position in terms of its ability to pay off its short-term debts and liabilities. The current ratio reveals that the company is able to pay every 1 of its short-term liabilities out of 1.3 worth of its assets. The quick ratio illuminates the company's liquidity position by showing that the company is left with 0.95 of quick assets after keeping aside stock. This is not a significant difference and thus reveals that not much of the company's current assets are trussed in stocks. Cash & Equiv % of Current Assets indicates that the percentage of cash & cash equivalents in the company's current assets (being only a quarter) has declined over the past years signifying a dangerous position for the company's liquidity as not all the current assets are easily convertible into cash at the time of need. The company collects its receivables within an average of 71 days as reflected by the Accounts Receivable days ratio, while it is able to finish its entire stock of goods in about 57 days as shown by inventory days ratio. Both of these ratios do not indicate a sound position because of the long time required to turn the assets into cash. Investment Ratios 2005 2004 2003 Earning Per Share 6.39 5.16 4.92 Dividends Per Share 2.55 2.40 2.30 Dividend Payout 37.23 58.06 54.26 Cash Dividend Coverage Ratio 5.49 4.19 4.55 Price/Earnings Ratio 11.89 13.76 14.35 The investment ratios are of vital importance to the company's shareholders and investors as they show the real worth of their investment. Lafarge's investment analysis shows an increase in dividend per share while a decline in dividend payout per share, which reflects that although the company's has been paying dividends to its shareholders at an increasing rate, yet it does not comply with the real worth of their investment. The cash dividend coverage ratio indicates that the company's earnings were sufficient enough to cover the dividends payable for more than 5 times. The relationship between EPS and price earnings ratio further highlights that although the company's earnings per share are rising at an increasing rate, yet the investors are not getting returns compatible with the shares' market price. Gearing Ratios 2005 2004 2003 Total Debt To Common Equity 89.59 96.96 107.16 LT Debt To Common Equity 70.26 82.64 90.83 LT Debt To Total Capital 35.25 38.71 41.42 Equity To Total Capital 50.17 46.84 45.60 Total Debt To Total Assets 31.70 33.00 35.11 Common Equity To Total Assets 35.39 34.04 32.77 Gearing ratios are of importance to the long-term creditors of the company, which help them analyse the future potential of the company as an investment and as a borrower. The above chart shows that the company's total debt to common equity has declined over the years, while the long-term debt to common equity and long-term debt to total capital has also been decreasing, which illuminates that the company is cutting off its reliance on borrowed funds to finance its operations. Similarly total debt to total asset has also declined showing that the company currently banks on less external debts to finance its assets against the internal funds i.e., those invested by owners or shareholders. This is also reflected in equity to total capital and common equity to total assets ratio, which highlights an increase in equity funds in the total capital spectrum to finance the company's activities. Thus, the company has a sound position in terms of gearing or solvency and faces less chances of bankruptcy. Sales For Three Years Sales Analysis 2005 2004 2003 Cement 5995 6948 6383 Aggregates & Concrete 4806 4768 4465 Gypsum Products 1072 1146 1194 Roofing 1585 1538 1510 Speciality products 240 210 106 Lafarge Group Total 13698 14610 13658 The aggregative sales of Lafarge group have declined in 2005 as compared to the previous year. The Cement and Gypsum products have had a decline for the last three years, mainly in 2005 while Roofing and A&C have maintained a stable position. The major rise in sales is highly noticeable in the specialty products where there has been a significantly rising trend for three years and shown an increase of 126% in the year 2005 as compared to 2003. However, the decline in the company's major sections Cement and Gypsum products has affected the company's aggregate sales revenue. Cash Flow Analysis Cash Flow Analysis Financials (millions) Horizontal Trend 2005 2004 2003 2005 2004 2003 Cash flow from operations 1,886 1,736 2,089 (9.7%) (16.9%) 100% Cash flow from investment 1,684 893 673 150.2% 32.69% 100% Cash flow from Financing -185 -793 -866 78.6% 8.4% 100% Net increase in cash 185 19 445 58.4% (95.7%) 100% Lafarge's cash flow analysis reflects that the company is obtaining most of its cash from operations i.e., the net profit and also from investment activities. The increasing cash inflow from both these activities suggests a rise in earnings as well as a reduction in the company's investment in fixed assets that has resulted into high cash inflow. On the contrary, much of the company's cash is being lost in the financing activities, however the condition has improved significantly in the year 2005 by about 77% as noticeable from the above statement, which has also resulted into a substantial increase in the company's total cash. References Flamholtz, Diane T. (1986), "Financial Accounting", Boston, MA: PWS-KENT Publishing Co. Meigs & Meigs (1993), "Accounting: The Basis For Business Decision Making", Mc Graw Hill: New York, p934 Mcmenamin Jim (1999), "Financial Management: An Introduction", Routledge, London Ahmed Riahi-Belkaoui (1998), "Financial Analysis and the Predictability of Important Economic Events", Quorum Books Read More
Cite this document
  • APA
  • MLA
  • CHICAGO
(The Financial Position and Performance of the Lafarge Company Case Study, n.d.)
The Financial Position and Performance of the Lafarge Company Case Study. Retrieved from https://studentshare.org/finance-accounting/1528362-lafarge-financial-statements
(The Financial Position and Performance of the Lafarge Company Case Study)
The Financial Position and Performance of the Lafarge Company Case Study. https://studentshare.org/finance-accounting/1528362-lafarge-financial-statements.
“The Financial Position and Performance of the Lafarge Company Case Study”, n.d. https://studentshare.org/finance-accounting/1528362-lafarge-financial-statements.
  • Cited: 0 times

CHECK THESE SAMPLES OF The Financial Position and Performance of the Lafarge Company

Financial Statement Analysis

the financial analysis is executed under categories of three tasks.... ainsbury Plc for three years ending with each company's fiscal year in 2008.... Task I contains background and… Task II contains the comparative financial analysis of both companies under three sub- headings, namely, profitability, liquidity, and activity performance (that also include an The Task III is an overall performance report with particular reference to effects of performances on market prices of each of the companies....
18 Pages (4500 words) Essay

The business and financial performance of J Sainsbury plc over the last three year period

Based on such allegations and with a goal to explore their fulness, this paper carried out an empirical study where it compared the firm's stock prices with those of its rivals as well as its own financial position over a span of three years and actually found that such ground of concern of the financial managers is not baseless and that the firm's position indeed has been deteriorating over the years.... the financial managers of J Sainsbury plc, in a recent board meeting expressed concern over the fact that the company has not been performing up-to-the-mark especially when compared with a number of other firms in the industry....
12 Pages (3000 words) Essay

La Farge as an Investment Decision

He has used the financial data from its published statements for a 5 year period from 2004 to 2008.... In 2008, it has a debt to equity ratio of 69% which means that the company uses more debt than equity.... This shows that the company has been aggressive in financing its growth through debts.... The company has been aggressive in financing its growth through debts.... However, analysts feel that a high debt financing may result to unstable earnings because of high interest that can be too much for the company to handle (Investopedia) The total debt to equity ratio of 115% shown in Table 1 is an analysis done by stockbrokers that is higher than the sector average (Table 1 attached) A high ratio is generally accepted to capital intensive industry that tends to have a higher ratio, according to Investopedia 2....
9 Pages (2250 words) Assignment

Financial Analysis of IT Companies

The company was founded in 1975 by William (“Bill”) Gates and Paul Allen in a suburban garage.... The company has matured and grown to be one of the Although the original focus of Microsoft was on PC development, it later changed its efforts towards the more profitable business side of software and application development.... Microsoft as a company soon achieved dramatic success and growth by becoming an operational system and personal productivity applications developer marketing giant (Windows, 2012)....
8 Pages (2000 words) Research Paper

Analysis and Interpretation of Financial Performance

That is why I identified the profitability ratios as the most efficient and effective way to evaluate the financial performance of the Wetherspoons Company.... Looking at Wetherspoons Company's financial statements and reports over the last five years, any potential investor would be very willing… From my analysis of the Company's current trading and financial position, I gathered the following; 26th October 2014, total sales increased by 11.... The company's The operating margin and operating profit stood at 7....
8 Pages (2000 words) Essay

Statement of Financial Position

The analysis of information by investors enables them to compare the past performance of the company, the position of the company with other industry and the whole market at large.... The investor can easily attain the amount shown on the statement of the financial position above (Financial Review, 2015, 1).... The paper 'Statement of financial position' presents many companies that use the statement of financial position to evaluate their performances in the business....
8 Pages (2000 words) Term Paper

Market Position of Harrods

This case study "Market Position of Harrods" apprehend the size and the nature of the finances and the competition within the company.... hellip; The Harrods company has got a verifiable concept in the positive reactions of the individual stores.... This means that the Harrods company is indeed a company for everyone and, the number of department stores is a plus to the company's profile.... nbsp; The stores of the company thus offer out various beauty products and fragrances....
6 Pages (1500 words) Case Study

Financial Performance and Position of the Business

The main reason for performing a ratio analysis is to quantify the results of the financial operations of an entity and analyze them in the light of the financial performance of the prior year(s) in order to assess different aspects of the financial feasibility.... om (2012]The financial ratio performance of the GAME Group Plc has been evaluated for the last three years in order to draw attention to various financial trends and significant changes over the period....
12 Pages (3000 words) Assignment
sponsored ads
We use cookies to create the best experience for you. Keep on browsing if you are OK with that, or find out how to manage cookies.
Contact Us