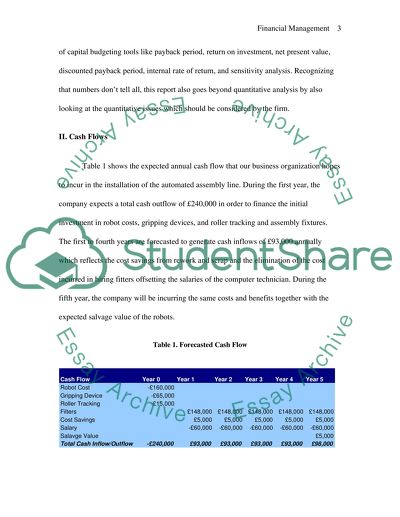
StudentShare
Contact Us
Sign In / Sign Up for FREE
Search
Go to advanced search...
Free

Financial Management and Risk Analysis - Case Study Example

Cite this document
Summary
The author of this case study "Financial Management and Risk Analysis" comments on the quest of every business organization to improve its production capacity and efficiency. Admittedly, improvement in efficiency often necessitates harnessing the advancement of technology…
Download full paper File format: .doc, available for editing
GRAB THE BEST PAPER98.1% of users find it useful
Financial Management and Risk Analysis
Read Text Preview

Extract of sample "Financial Management and Risk Analysis"

Running Header: FINANCIAL MANAGEMENT AND RISK ANALYSIS Financial Management and Risk Analysis in APA Style by Name University I. Introduction It is the quest of every business organization to improve its production capacity and efficiency. This improvement in efficiency often necessitates harnessing the advancement of technology and changing the structure of production. It is in this line that our business organization is contemplating on the replacement of the current sub-assembly line with an automated one. The new technology is expected to boost the firm's production capacity as well as eliminate inefficiencies such as rework/scrap and wastage. Currently, the production department utilizes a manual assembly line which eight fitters who are paid 18,500 per annum each. The new automated assembly line will be requiring the purchase of five new robots, each costing $32,000 and associated gripping devices costing a total of 65,000. Roller tracking and new assembly fixtures will also be needed adding up to a cost of 15,000. The new assembly cells will be manned by three cell programmers/operators who will be paid 20,000 each. The finance department estimates that installing the automated system will generate an annual cost savings of 5,000 due to the reduction in reduction in scrap and rework. After five years, the robots can be sold each with market value of 1000. This report will analyse the possibility of investment in the new assembly line by utilizing financial management tools. The first section will look at the annual expected cash inflows and outflows. The next will be an analysis of the investment through the use of capital budgeting tools like payback period, return on investment, net present value, discounted payback period, internal rate of return, and sensitivity analysis. Recognizing that numbers don't tell all, this report also goes beyond quantitative analysis by also looking at the quantitative issues which should be considered by the firm. II. Cash Flows Table 1 shows the expected annual cash flow that our business organization hopes to incur in the installation of the automated assembly line. During the first year, the company expects a total cash outflow of 240,000 in order to finance the initial investment in robot costs, gripping devices, and roller tracking and assembly fixtures. The first to fourth years are forecasted to generate cash inflows of 93,000 annually which reflects the cost savings from rework and scrap and the elimination of the cost incurred in hiring fitters offsetting the salaries of the computer technician. During the fifth year, the company will be incurring the same costs and benefits together with the expected salvage value of the robots. Table 1. Forecasted Cash Flow III. Payback Period The payback method is one of the most popular tools in conducting capital budgeting decision. The payback period tells the company the length of time required to recoup the original investment through investment cash flows. This is essentially the time when the company breaks even-the initial capital outlay is equal to the cash flows. Considering that the business organization invests in a project which generates the same level of cash flow annually, the payback period is computed as the follows: Payback = Initial Investment Annual Cash Flow (equation 1) However, if the investment generates unequal annual cash flows, then the individual annual cash flows are subtracted from the initial investment until a difference of zero is reached (Lightfoot 2003). The year when cash flow equals investment is the payback period. Other things being equal, the investment with a low payback period is chosen as it implies less risk for the company. Table 2. Payback Period Table 2 shows how the pay back period for the proposed automated assembly line. As the investment yields unequal cash flow for the five-year period, this report simply subtracted the yearly cash inflow to the total amount of the investment. The cash outlay for the proposed project is expected to be recouped in 2.58 years. IV. Return on Investment (ROI) Return on investment is "performance measure used to evaluate the efficiency of aninvestment or to compare the efficiency of a number of different investments" (Return on Investment 2006). It is computed as: Return on Investment = Gain from Investment - Cost of Investment Cost of Investment Table 3 shows the computed return on investment for the new assembly cell. It should be noted that the cash inflows are treated as the gains while the total cash outflows (the investment and the salary) are treated as investments. The computation yields an ROI of 0.43 or 43% for the project. Table 3. V. Net Present Value he net present value (NPV) of a project represents the present value of the total cash inflows and outflows. The NPV can be calculated by discounting the cash flows according to the required rate of return. the NPV can be mathematically represented as: (equation 2) where Ct is the cash flow in time t, Co is the cash flow during the first year, and r is the required rate of return. Table 4. Net Present Value The computed NPV for the project is shown at Tab le 3. It should be noted that the forecasted cash flows are multiplied by the present value factor at 10%. The company has already preset a 10% cost of capital which is also utilized for this analysis. The computations yield an NPV of 115,630 for the proposed assembly line. The relatively large positive NPV implies that the business organization will be gaining far more than the required cost of capital. VI. Discounted Payback Period One of the major flaws of the payback period is that it ignores the tie-value of money which has the tendency to over-estimate the value of the cash flows. In the recognition that the amount of pounds shrinks over time, the discounted payback period is also employed (Lightfoot 2003). As opposed to the ordinary payback period, the discounted payback takes into account the time value of money. With this, the cash flows used are discounted at 10% which is the company's cost of capital. Table 4. Discounted Payback Period The formula for payback period with unequal stream of cash flow is again used for the computation of discounted cash flow. The annual cash inflows are individually subtracted from the amount of initial investment until the gap zeroes in. It should be noted that the discounted payback period is higher than the ordinary payback period. Discounting the cash flows yield a payback period of 3.14 years as opposed to the 2.58 in the previous section. This discrepancy accounts for the difference between the nominal and present value of future cash inflows. VII. Internal Rate of Return The internal rate of return is the cost of capital that will equate the present value of future cash flows to zero. In other words, it is the required rate of return which will yield a zero NPV (Keown et al. 2004). Thus, equation 1 can be modified such that NPV is replaced by 0. NPV calculations can be done manually but the process is tedious as it requires calculating the NPV by using different values of cost of capital. Another is the use of software like Microsoft Excel to generate a more accurate figure. Table 5. Internal Rate of Return Table 5 shows the NPVs computed according to a varying level of cost of capital. It can be seen that at costs of capital less that 27%, NPV is always positive. On the other hand, NPVs computed at costs of capital greater than 27% will yield negative results. With this, it can be deduced that the internal rate of return is approximately equal to 27%. Using a spreadsheet like Microsoft Excel gives the exact amount which is 27.35%. IIX. Sensitivity Analysis According to Keown et al (2004, pp216) , sensitivity analysis "involves determining how the distribution of possible net present values or internal rates of return for a particular project is affected by a change in a particular input variable." Sensitivity analysis can be simply stated as how the value of NPV varies with the changes in cash flows. In conducting a sensitivity analysis, it is extremely important to consider which of the factors in the cash flows are much likely to be volatile or affected by changes on the market or business environment. In our cash flows above, it can be noted that salary is much likely to become volatile. It should be noted that employees often expect and demand salary increases as they spend longer period in the business organisation. It is also a fact that technicians who will be manning each assembly cell might be endowed with extensive knowledge on robots and computers. It is irrefutable that these employees are often scarce so different companies offer high compensation packages in order to attract them. Thus, our firm should also be open to the possibility of this by taking into account the possible increases in salary. For our sensitivity analysis, we take three scenarios: first, when salary increases by 5% annually after the first year; worse, when salary increases by 10% annually after the first year; and worst case, when salary increases by 20% annually after the first year. Table 6 shows the resulting cash flows for each scenario. Table 6. Cash Flows from the Three Scenarios Figure 1 shows the graph representing how NPV will react to the increase in the salaries of the three technicians. Logically, increase in salaries automatically makes the cash flow and the NPV decline. However, in the three scenarios, it should be noted that the computed NPVs at 10% cost of capital are still positive implying the profitability of the projects even though the salaries will increase by 20% annually after the first year. Figure 1. Sensitivity Analysis IX. Other Considerations and Conclusion According to the calculation and analysis of the finance department, the proposal to change the current manual assembly line with automated assembly cells seems to be financially feasible and profitable. The investment will be recouped in 2.5 8 years and will yield a return of 43%. The investment also has a large positive NPV which implies that the costs are more than offset by the expected benefits. Even if the cash flows are discounted, the payback period is still relatively low at 3.2 years. It should also be noted that IRR is very high (27%) compared to the cost of capital (10%) insulating the investment fro m negative NPV even if the salaries of the robot technicians are significantly increased. Aside from these positive results, some qualitative issues should still be considered before pursuing the proposed changes in production. It should be noted that changes in the current production system will significantly alter the way the whole organisation does business. In the first year of the automated assembly cell, it is expected that our business organisation must deal with the frictions arising from unfamiliarity. As it will only be in the introductory stage, workers might find it difficult to adjust. The company also deals with the possibility of hesitance among its manual laborers. The new automated assembly cell necessitates laying-off some employees. With this the company should be ready to compensate these employees or channel them to other departments. References Antes, G 2003, ROI Guide: Payback Period, Retrieved 26 November 2006, from http://www.computerworld.com/managementtopics/roi/story/0,10801,78529,00.ht ml Keown, A.J., Martin, J.D., Petty, J.W., and Scott Jr., D.F (2005) Financial Management principles and applications, Pearson/Prentice Hall International Edition, 10th Edition. Lightfoot, D (2003). Return on Investment in CTP. Retrieved 26 November 2006, from http://www.newsandtech.com/ctp_chicago/presentations/ROI.pdf Return on Investment (2006). Investopedia. Retrieved 26 November 2006, from http://www.investopedia.com/terms/r/returnoninvestment.asp Read More
Cite this document
  • APA
  • MLA
  • CHICAGO
(Financial Management and Risk Analysis Case Study, n.d.)
Financial Management and Risk Analysis Case Study. Retrieved from https://studentshare.org/finance-accounting/1519348-financial-management-and-risk-analysis
(Financial Management and Risk Analysis Case Study)
Financial Management and Risk Analysis Case Study. https://studentshare.org/finance-accounting/1519348-financial-management-and-risk-analysis.
“Financial Management and Risk Analysis Case Study”, n.d. https://studentshare.org/finance-accounting/1519348-financial-management-and-risk-analysis.
  • Cited: 0 times

CHECK THESE SAMPLES OF Financial Management and Risk Analysis

RISK MANAGEMENT

Your name Your class and section Your professor date Risk management and the Risk Culture Risk is the probability of loss.... (Horcher, 2005) (Das, 2006) Operational risk management concerns both management and measurement of risk.... Traditionally, operations risk management involved all the company processes and systems, all employees for management and training, and any external event, such as political interference.... Management establishes quantitative analysis tools to measure risk culture compliance....
4 Pages (1000 words) Essay

Financial Analysis of Granite Construction Industry Plc

Passive investors carry out their investment decisions based on the assumption that the market price is a fair price for the risk taken, that is, that market forces have driven the price to the appropriate point.... Therefore, both the passive and intuitive investor run the risk of trading with someone who has done his homework well, that is, someone who has analysed the information thoroughly.... Globalisation, the new information technology, and deregulation of financial markets have eased the provision and search of finance....
15 Pages (3750 words) Essay

Environmental Trends That Create Business Opportunities

30) states that “the first approach to identifying opportunities is to observe trends”.... There are four environmental trends which, when encounter changes, bring about opening of new business opportunities.... Let's explain these with examples. Changes in… In other words, their buying patterns are determined by the state of the economy....
4 Pages (1000 words) Essay

Global Business Venture

Alternatively, the foreign exchange risk will exist when the foreign lesser of the global venture maintains financial statements that is in the currency which is not part of the reporting currency and in this case the consolidated entity.... Some of the common types of challenges that would most likely affect the venture due to foreign exchange risk include; translation exposure, economic exposure, and transaction exposure (Rush, 2012).... In most cases, issues to do with financial risks tend to affect the business if not well taken care of (Rush, 2012)....
4 Pages (1000 words) Essay

Risk Management in Brewin Dolphin Holdings Plc

The company operations are divided into two segments such as the investment management and corporate advisory and broking.... There is an increase in the demand for personal financial management advisory services.... This research is being carried out to evaluate and present an in-depth analysis on the company and its business activities, its market analysis and the competitor analysis, and the company's approach to manage various risks such as the exchange rate risks and political risks....
15 Pages (3750 words) Essay

Financial Performance and Risk management of Domino Printing

Furthermore, the risks management related to exchange rate risk and country and political risk will be evaluated.... The share of global sales of the company in different regions is illustrated below: In this report, the competition circumstances and international business operation will be discussed with the help of analyzing the Domino printing plc financial performance....
10 Pages (2500 words) Essay

Managing Financial Risks

This essay "Managing Financial Risks" discusses ways to manage risks which also includes the types of financial risks, types of capital structure, financing arrangements of the project, analysis of relevant project agreements, identification of potential impacts of regulatory issues, and key risk management method.... hellip; risk can be an opportunity but also a danger.... Each company faces a different types of risk and the way to manage the risk is depending on what and how well the company is willing to bear with the risk....
9 Pages (2250 words) Essay

Capital Funding Structure

he efficient management of available resources maximizes the value of the company.... This paper "Capital Funding Structure" focuses on the fact that the financial structure is linked with the market conduct by theoretical literature emphasizing the strategic use of leverage.... Undue reliance on any one source can be detrimental for the financial health of the company.... These costs being the financial distress like the bankruptcy costs as well as the non-bankruptcy costs that include the unfavourable demands of the suppliers....
10 Pages (2500 words) Case Study
sponsored ads
We use cookies to create the best experience for you. Keep on browsing if you are OK with that, or find out how to manage cookies.
Contact Us