StudentShare
Contact Us
Sign In / Sign Up for FREE
Search
Go to advanced search...
Free

Financial Reporting and Analysis of Apple - Essay Example

Cite this document
Summary
The paper "Financial Reporting and Analysis of Apple" observes Apple Inc. as a manufacturer of personal computers and communication devices. Its product profile includes iPhone, iPod, iPad, a multi-purpose mobile device; desktop. The software products include iOS and OS X operating systems…
Download full paper File format: .doc, available for editing
GRAB THE BEST PAPER95% of users find it useful
Financial Reporting and Analysis of Apple
Read Text Preview

Extract of sample "Financial Reporting and Analysis of Apple"

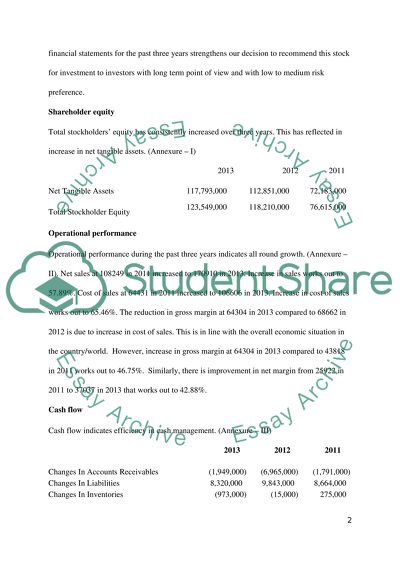
?Apple Inc: Financial Research Report Introduction Apple Inc. is a manufacturer of personal computers and communication devices. Its product profile include iPhone, iPod, iPad, a multi-purpose mobile device; desktop. The software products include iOS and OS X operating system. The company manufactures and sells Apple branded and other electronic devices like Apple TV and digital video cameras. The growth of markets for consumer goods during the recent years in developing countries like India and China holds promise for stability in earnings and sustainable growth of the company in the long run. The stock’s high – low prices in 52 week range are 385.10 - 575.14 as on 6 December 2013 with closing price at 559.99 (Yahoo! Finance, 2013a). Being a diversified company, there are several competitors to Apple in various product ranges. In smart phones Samsung can be considered as a major competitor. Amazon and Microsoft are its competitors for iPad. Google is a tough competitor in many ways. Android smart phone of Motorola, a Google’s subsidiary competes with iPhone. Cloud service Google Drive can be considered as competition to Apple’s iCloud.   Rationale for investment The important factor influencing the decision to invest in Apple Inc. is its position in market vis-a-vis with its competitors. Gryta (2013) observes “Apple and Samsung devices hold their values reasonably well. BlackBerry and Nokia not so much… Apple’s iOS and Google’s Android are more developed with applications than the more recent operating systems from BlackBerry and Microsoft.” Apple’s ability to charge premium prices for its products in the market indicates its superior technology and brand loyalty. Therefore, stability of the operations in terms of sales and profitability in the future is assured, considering the growth prospects of consumer electronic goods and the development of new markets. Analysis of financial statements for the past three years strengthens our decision to recommend this stock for investment to investors with long term point of view and with low to medium risk preference. Shareholder equity Total stockholders’ equity has consistently increased over three years. This has reflected in increase in net tangible assets. (Annexure – I) 2013 2012 2011 Net Tangible Assets 117,793,000   112,851,000   72,183,000   Total Stockholder Equity 123,549,000   118,210,000   76,615,000   Operational performance Operational performance during the past three years indicates all round growth. (Annexure – II). Net sales at 108249 in 2011 increased to 170910 in 2013. Increase in sales works out to 57.89%. Cost of sales at 64431 in 2011 increased to 106606 in 2013. Increase in cost of sales works out to 65.46%. The reduction in gross margin at 64304 in 2013 compared to 68662 in 2012 is due to increase in cost of sales. This is in line with the overall economic situation in the country/world. However, increase in gross margin at 64304 in 2013 compared to 43818 in 2011 works out to 46.75%. Similarly, there is improvement in net margin from 25922 in 2011 to 37037 in 2013 that works out to 42.88%. Cash flow Cash flow indicates efficiency in cash management. (Annexure – III) 2013 2012 2011 Changes In Accounts Receivables (1,949,000) (6,965,000) (1,791,000) Changes In Liabilities 8,320,000   9,843,000   8,664,000   Changes In Inventories (973,000) (15,000) 275,000   Reduction in accounts receivable indicates efficiency in collections. Liabilities are under control and more or less at the same level in 2013 compared to 2011. Reduction in inventory represents efficiency in materials management. Changes in accounts receivable and inventories should be viewed in the back drop of increased sales over the period. Therefore, positive changes in these cases in spite of increase in sales can be considered as an achievement. Taxation In respect of taxation the company stated, ‘Management believes that an adequate provision has been made for any adjustments that may result from tax examinations’ (UNITED STATES SECURITIES AND EXCHANGE COMMISSION 2013, p. 66). Therefore, charces for surprises on account of demand by income tax authorities are limited. Though the outcome could not be predicted with any certainty, it appears that there is no cause for serious concern in respect of any ‘unforeseen’ factors. Therefore, the outcomes are not expected to materially affect the financial statements of the company pertaining to the earlier years Investment policy The Company is following investment policies and strategies that are aimed at liquidity and preservation of capital. The company has entrusted the task of managing company’s cash to the external fund managers. These fund managers are allowed to make investments in line with the company’s investment policies and market benchmarks. The company invests only in highly rated securities in the market and limit its exposure to different issuers. Therefore, the risks associated with these investments are very negligible. The Company has been investing in projects to enhance reseller sales and intends to continue this strategy in the future. Though there is no assurance of any return on investment, this will ensure ensure regular off-take of the company’s products by resellers. Risk management policy The company stated that ‘to manage the risk of adverse fluctuations in interest rates associated with the floating-rate notes, the Company entered into interest rate swaps with an aggregate notional amount of $3.0 billion, which, in effect, fixed the interest rate of the floating-rate notes’ The Company reviews assets like property, plant and equipment, prepayments and certain identifiable intangibles excluding goodwill for impairment. Long-lived assets are reviewed for impairment whenever events or changes in circumstances indicate that the carrying amount of an asset may not be recoverable. The company is exposed to exchange rate risk in respect of its operations globally. Strengthening of US Dollar will be detrimental and affect sales and profitability. The company enters into foreign exchange forward contracts and option contracts to mitigate the damages, foreseen in business operations. Accounting and valuation ‘Management believes the Company’s critical accounting policies and estimates are those related to revenue recognition, valuation and impairment of marketable securities, inventory valuation and valuation of manufacturing-related assets and estimated purchase commitment cancellation fees, warranty costs, income taxes, and legal and other contingencies’ (UNITED STATES SECURITIES AND EXCHANGE COMMISSION 2013, p. 38). The company has the policy of reviewing inventory and intangible assets for impairment if the carrying amount in the books of account is not recoverable. This is line with the standard international accounting policies. Stock repurchase program ‘In 2012, the Company’s Board of Directors authorized a program to repurchase up to $10 billion of the Company’s common stock. In April 2013, the Company’s Board of Directors increased the share repurchase program authorization from $10 billion to $60 billion, of which $23.0 billion had been utilized as of September 28, 2013’ (UNITED STATES SECURITIES AND EXCHANGE COMMISSION 2013, p. 22). It is an important point to note that the management of a company resorts to repurchase program when it feels that the company’s shares are underpriced heavily due to market conditions. Vermaelen, T. (2005, p. 1) stated, ‘a repurchase is a microcosm of corporate finance. First, it is an investment decision, an investment in itself... Second, it is a payout decision, as an alternative to paying a dividend. Third, it is a capital structure decision as it increases the company’s financial leverage. Fourth, it is a decision to change ownership structure of the company...’ The companies intend to prop up the prices of the shares in the market through repurchase program and reduce the outstanding shares for the benefit of the promoters or the remaining shareholders to take the market condition as an opportunity. In this case, the company engages in massive share repurchase program by increasing the amount allocated $10 billion for the repurchase program to $60 billion in2013. Since the company is very confident of low valuation it has already repurchased stock worth $23 billion as of September 28th 2013. Therefore, the shares of the company under current prices are undervalued compared to its potential market value. This could be considered as an important factor in making investment decision in respect of this stock. Ratio Analysis Gibson (2013, p. 200) stated, ‘Ratios are interpretable in comparison with (1) prior ratios, (2) ratios of competitors, (3) industry ratios, and (4) predetermined standards.’ Analysis of important ratios indicates a healthy financial position of Apple. Current Ratio Liquidity in the company is very important for uninterrupted flow of business. Current ratio comparing current assets to current liabilities provides an indication to the liquidity position of the company. Formula : Current Assets Current Liabilities = 73,286,000 / 43,658,000 = 1.69 for 2013 = 57,653,000 / 38,542,000 = 1.50 for 2012 = 44,988,000 / 27,970,000 = 1.61 for 2011 Current ratio at 1 is preferable, though the norm varies from industry to industry. Current ratio in Apple at 1.68 indicates that liquidity in the business is very good. It is also an indication of efficiency in the management of current assets by the organization. In the case of Apple, it could be observed that this ratio has improved from 1.50 in 2012 to 1.69 in 2013. Quick ratio Quick ratio is useful in assessing the liquidity position on day to day working capital management and closely related to cash flow. Formula : Cash And Cash Equivalents + Net Receivables Current Liabilities = 38,353,000 / 43,658,000 = 0.88 for 2013 = 32,021,000 / 38,542,000 = 0.83 for 2012 = 23,546,000 / 27,970,000 = 0.84 for 2011 We have considered only cash and cash equivalents and net receivables for the purpose of calculation. The ratio compares this with current liabilities. The quick ratio excludes inventory and other current assets. This test is very stringent in application relating to measurement of liquidity. We have not considered short term investments or other current assets since the company has clearly excluded this from cash and cash equivalents. Quick ratio in Apple is good. There is improvement in quick ratio from 0.83 in 2012 to 0.88 in 2013. Earnings per share (EPS) The measure Earnings per Share indicates company’s profitability. It is calculated as below: Formula ________Net income___________ Average outstanding number of shares It is considered as an important indicator in determination of the share prices, and the investors rely on this indicator for assessing the financial performance of the companies. 2013 2012 2011 Net income    $ 37,037       $ 41,733       $ 25,922                          Earnings per share:          Basic    $ 40.03       $ 44.64       $ 28.05 Diluted    $ 39.75       $ 44.15       $ 27.68 Shares used in computing earnings per share:          Basic      925,331         934,818         924,258 Diluted      931,662         945,355         936,645 Cash dividends declared per common share    $ 11.40       $ 2.65       $ 0.00 Price earnings ratio In calculation of this ratio, current share price of a company is divided by earnings per share relating to the company. Since the price of a share is related to earnings per share this ratio is used for comparison with other companies, especially in the same industry. Formula Market Price of share Earnings per share The market price of Apple Inc. closed at 559.99 on 6 December 2013. (Yahoo! Finance, 2013a). Based on this price, the P/E ratio works out as below: Current P/E ratio of Apple Inc Based on basic EPS = 559.99 / 40.03 = 13.99 Based on diluted EPS = 559.99 / 39.75 = 14.09 It is also called as Price Earnings Multiple since the market price is expressed in terms of number of times the earnings per share. A high P/E ratio usually indicates the market expects growth in earnings in the future. Comparison of this ratio of the companies within the same industry would be useful in assessing the financial performance of the companies. This can also be used for comparison of historical performance. It is important to note that P/E ratio of companies in emerging technology industries will be very high compared to companies in other industries. From this point of view and on comparison with Apple’s competitors like Google, it can be said that the P/E ratio of Apple is very low signifying attractive valuation at the current price level with an upward potential in the future. Gross Profit Margin This is an important ratio with reference to profitability. The relationship between gross profit margin and net sales compared to industry average or best performing company in the industry will reveal cost-volume-profit relationship for decision making. Formula Gross Profit Net Sales This ratio is important in decision making for various issues such as exports, make or buy decisions and outsourcing. Debt equity ratio Financial leverage of the company is very important in relation to analysis of capital structure of the company. Debt to equity ratio is an important measure in this respect and it is calculated as below: Formula Total liabilities Shareholder equity Debt equity ratio of Apple Inc. in 2013 2012 2011 83451000/ 57854000/ 39786000/ 123549000 118210000 7661500 = 0.675 = 0.489 = 0.519 Though only long-term debt can also be used for calculations, we have considered total liabilities for our calculation purposes to be conservative in our approach. Companies with high debt equity ratio will lead to volatility in earnings. Interest burden on long term loans will be very high if the project is financed more with debts, and debt servicing will be very difficult in lean periods. Ghosh (2012, p. 9) stated, ‘But issuing new stocks gives a negative signal to the effect that the stock is overvalued and the company has poor growth prospects, and wants to pass the burden to the new shareholders.’ In capital intensive industries debt equity ratio could be as high as 2. In the case of technology companies it tends to be low. In the case of Apple, it is around 0.50% which is very reasonable. Increase in long term debt is mainly due to stock repurchase scheme which will benefit the shareholders in the long run with superior returns on their investments. Howakimian, Opler, & Titman (2001, p. 2) stated, ‘firms tend to move toward a target debt ratio when they either raise new capital or retire or repurchase existing capital.’ Stock price analysis Source: Yahoo! Finance (2013d) Technically, the stock has been in uptrend for a long time. There was some correction from the peak price of 575.14 that took the stock to 385.10 in July 2013. The stock has bottomed out in July 2013 and resumed its uptrend. The stock has formed higher bottoms and higher tops and it is poised to breach its 52 week high. 50 day moving average curve is breaching 200 day moving average curve from below and it is above 200 day moving average now. This shows the strength of the upward movement of the stock. Next earnings date for the stock is 23 January 2014. A break-out from these levels cannot be ruled out considering the developments in economic front.  Currently, P/E multiple is 14.09 for Apple, 29.12 for Google and 33.53 for Yahoo! A P/E multiple of around 22 can be considered reasonable in view the size of the company, consistency in performance, growth potential of the industry and management performance of the company in respect of Apple. Therefore, at EPS around 40 the stock has the potential to go up to 880 in the long run. If the company announces results with significant improvement over previous period, the expectation about the future earnings will increase substantially that could drive up the price further. Investment opportunity The sound financial management strategies that are important for supporting business operations in various market environments include conservatism is using debt for growth, avoiding liquidity constraints by maintaining reasonable current ratio and ensuring stability in earnings through diversification. The conservative policies followed by the company in respect of working capital management and capital structure form the strong basis for sustainable growth in long term in the future. Stock repurchase program embarked on by the company strengthens our view with regard to its potential for growth. Working capital management Ratio analysis assumes significance from the perspective of working capital management. The financial manager can use number of controls for effective financial management. For example monitoring cash turnover ratio, that is net sales divided by cash, will indicate effectiveness in utilization of cash. Control over cash flow is an important factor in working capital management. Relationship between working capital can be measured by Sales to working capital ratio that indicates level of efficiency in working capital management and tightness in liquidity position. Establishing norms for ratios such as receivables turnover and payables turnover will be useful for making historical comparisons and comparisons within the industry. Similarly, inventory turnover is calculated with reference cost of sales. Gill, Biger, & Mathur (2010) stated, ‘The finding indicates that slow collection of accounts receivables is correlated with low profitability.’ For example receivables expressed in number of days’ sale will be useful in decision making. If the number of days increases it will have negative impact on working capital, because more working capital is tied up in receivables. On the other hand increase in number of days in the case of payables indicates that there is tighter working capital situation in the company. For instance, receivable turnover for Apple works out as below: Receivable turnover 2013 2012 2011 Net Sales 170910000 156508000 108249000 Net Receivables 24094000 21275000 13731000 Receivables/(Net Sales/365) in no. of days 51 50 46 It could be observed that collection period has increased from 46 days in 2011 to 50 days in 2012 and maintained at 51 during 2013. In view of expansion of sales during the period the receivable turnover has increased in terms of number of days’ outstanding. However, maintaining at the current level is important for efficiency in working capital management. Recommendation and conclusion According to Arnold (2013) three reasons to buy Apple Stock are The Apple Brand, Sticky Ecosystem and Premium Pricing. Brand loyalty has been assiduously built-up by Apple co-founder and CEO Steve Jobs. Bonding of people to an ecosystem exclusive of others is the basis for stability and long term growth. The company’s ability to charge premium for its products increases its profitability and financial strength which are exhibited in the company’s financial statements. Therefore, an investor with long term view on investments expecting stability in earnings and decent growth can consider investing in Apple Inc. with very low to medium risk. References Arnold, N. (2013). Analyst: Apple’s Secondhand iPhones Are Worth More than Competitors’ Smartphones. Wall St. CheatSheet. 2 August 2013. Retrieved from http://wallstcheatsheet.com/stocks/analyst-apples-secondhand-iphones-are-worth-more-than-competitors-smartphones.html/ Gill, A., Biger, N. & Mathur, N. (2010). The Relationship Between Working Capital Management And Profitability: Evidence From The United States. Business and Economics Journal, Volume 2010: BEJ-10 Ghosh, A. (2012). Capital Structure and Firm Performance. New Jersey: Transaction Publishers. Gibson, C. H. (2013). Financial Reporting and Analysis. (13th ed.) Mason OH: Cengage Learning. Gryta, T. (2013). Which Smartphones Retain the Most Resale Value? The Wall Street Journal: Digits. 30 July 2013. Retrieved from http://blogs.wsj.com/digits/2013/07/30/which-smartphones-retain-the-most-resale-value/ Howakimian, A., Opler, T. & Titman, S. (2001). The Debt-Equity Choice. JOURNAL OF FINANCIAL AND QUANTITATIVE ANALYSIS VOL 36, NO. 1, MARCH 2001. UNITED STATES SECURITIES AND EXCHANGE COMMISSION (2013). Annual Report pursuant to section 13 or 15(d) of the Securities Exchange Act of 1934 for the fiscal year ended September 28, 2013. Retrieved from http://investor.apple.com/secfiling.cfm?filingID=1193125-13-416534&CIK=320193 Vermaelen, T. (2005). Share Repurchases. Foundation and Trends in Finance 1:3 (2005) Hanover MA now Publishers. Yahoo! Finance. Apple Inc. (AAPL). 7 December 2013. a. http://finance.yahoo.com/q?s=AAPL&fr=uh3_finance_vert_gs&type=2button&uhb=uhb2 b. http://finance.yahoo.com/q/bs?s=AAPL+Balance+Sheet&annual c. http://finance.yahoo.com/q/cf?s=AAPL+Cash+Flow&annual d. http://finance.yahoo.com/q/ta?s=AAPL&t=5y&l=on&z=l&q=l&p=m200%2Cm50%2Cv&a=m26-12- 9&c= Annexure – I Apple Inc. (AAPL) Balance Sheet Period Ending Sep 28, 2013 Sep 29, 2012 Sep 24, 2011 Assets Current Assets Cash And Cash Equivalents 14,259,000   10,746,000   9,815,000   Short Term Investments 26,287,000   18,383,000   16,137,000   Net Receivables 24,094,000   21,275,000   13,731,000   Inventory 1,764,000   791,000   776,000   Other Current Assets 6,882,000   6,458,000   4,529,000   Total Current Assets 73,286,000   57,653,000   44,988,000   Long Term Investments 106,215,000   92,122,000   55,618,000   Property Plant and Equipment 16,597,000   15,452,000   7,777,000   Goodwill 1,577,000   1,135,000   896,000   Intangible Assets 4,179,000   4,224,000   3,536,000   Accumulated Amortization -   -   -   Other Assets 5,146,000   5,478,000   3,556,000   Deferred Long Term Asset Charges -   -   -   Total Assets 207,000,000   176,064,000   116,371,000   Liabilities Current Liabilities Accounts Payable 36,223,000   32,589,000   23,879,000   Short/Current Long Term Debt -   -   -   Other Current Liabilities 7,435,000   5,953,000   4,091,000   Total Current Liabilities 43,658,000   38,542,000   27,970,000   Long Term Debt 16,960,000   -   -   Other Liabilities 20,208,000   16,664,000   10,100,000   Deferred Long Term Liability Charges 2,625,000   2,648,000   1,686,000   Minority Interest -   -   -   Negative Goodwill -   -   -   Total Liabilities 83,451,000   57,854,000   39,756,000   Stockholders' Equity Misc Stocks Options Warrants -   -   -   Redeemable Preferred Stock -   -   -   Preferred Stock -   -   -   Common Stock 19,764,000   16,422,000   13,331,000   Retained Earnings 104,256,000   101,289,000   62,841,000   Treasury Stock -   -   -   Capital Surplus -   -   -   Other Stockholder Equity (471,000) 499,000   443,000   Total Stockholder Equity 123,549,000   118,210,000   76,615,000   Net Tangible Assets 117,793,000   112,851,000   72,183,000   Source: Yahoo! Finance (2013b) Annexure – II Apple Inc. (AAPL) CONSOLIDATED STATEMENTS OF OPERATIONS (In millions, except number of shares which are reflected in thousands and per share amounts)        Years ended        September 28, 2013      September 29, 2012      September 24, 2011   Net sales    $ 170,910       $ 156,508       $ 108,249    Cost of sales      106,606         87,846         64,431                               Gross margin      64,304         68,662         43,818                               Operating expenses:          Research and development      4,475         3,381         2,429    Selling, general and administrative      10,830         10,040         7,599                               Total operating expenses      15,305         13,421         10,028                               Operating income      48,999         55,241         33,790    Other income/(expense), net      1,156         522         415                               Income before provision for income taxes      50,155         55,763         34,205    Provision for income taxes      13,118         14,030         8,283                               Net income    $ 37,037       $ 41,733       $ 25,922                               Earnings per share:          Basic    $ 40.03       $ 44.64       $ 28.05    Diluted    $ 39.75       $ 44.15       $ 27.68    Shares used in computing earnings per share:          Basic      925,331         934,818         924,258    Diluted      931,662         945,355         936,645    Cash dividends declared per common share    $ 11.40       $ 2.65       $ 0.00    Source: UNITED STATES SECURITIES AND EXCHANGE COMMISSION (2013). Annexure – III Apple Inc. (AAPL) Cash flow Period Ending Sep 28, 2013 Sep 29, 2012 Sep 24, 2011 Net Income 37,037,000   41,733,000   25,922,000   Operating Activities, Cash Flows Provided By or Used In Depreciation 6,757,000   3,277,000   1,814,000   Adjustments To Net Income 3,394,000   6,145,000   4,036,000   Changes In Accounts Receivables (1,949,000) (6,965,000) (1,791,000) Changes In Liabilities 8,320,000   9,843,000   8,664,000   Changes In Inventories (973,000) (15,000) 275,000   Changes In Other Operating Activities 1,080,000   (3,162,000) (1,391,000) Total Cash Flow From Operating Activities 53,666,000   50,856,000   37,529,000   Investing Activities, Cash Flows Provided By or Used In Capital Expenditures (8,165,000) (8,295,000) (4,260,000) Investments (24,042,000) (38,427,000) (32,464,000) Other Cash flows from Investing Activities (1,567,000) (1,505,000) (3,695,000) Total Cash Flows From Investing Activities (33,774,000) (48,227,000) (40,419,000) Financing Activities, Cash Flows Provided By or Used In Dividends Paid (10,564,000) (2,488,000) -   Sale Purchase of Stock (22,330,000) 665,000   831,000   Net Borrowings 16,896,000   -   -   Other Cash Flows from Financing Activities (1,082,000) (1,226,000) (520,000) Total Cash Flows From Financing Activities (16,379,000) (1,698,000) 1,444,000   Effect Of Exchange Rate Changes -   -   -   Change In Cash and Cash Equivalents 3,513,000   931,000   (1,446,000) Source: Yahoo! Finance (2013c) Read More
Cite this document
  • APA
  • MLA
  • CHICAGO
(“Financial Research Report Essay Example | Topics and Well Written Essays - 2500 words”, n.d.)
Financial Research Report Essay Example | Topics and Well Written Essays - 2500 words. Retrieved from https://studentshare.org/finance-accounting/1495010-financial-research-report
(Financial Research Report Essay Example | Topics and Well Written Essays - 2500 Words)
Financial Research Report Essay Example | Topics and Well Written Essays - 2500 Words. https://studentshare.org/finance-accounting/1495010-financial-research-report.
“Financial Research Report Essay Example | Topics and Well Written Essays - 2500 Words”, n.d. https://studentshare.org/finance-accounting/1495010-financial-research-report.
  • Cited: 0 times

CHECK THESE SAMPLES OF Financial Reporting and Analysis of Apple

International Financial Reporting Standards for Nestle

The aim of the report "International financial reporting Standards for Nestle" is to generate awareness of IFRS to the non-executive directors of Nestle.... International financial reporting Standards (IFRS) are defined as a collection of accounting standards instituted by the International Accounting Standard Board (IASB) which is the international benchmark for the arrangement of financial statements of public companies.... By adopting International financial reporting Standards, companies can present their financial reports on a similar basis....
8 Pages (2000 words) Essay

DuPont Analysis: Apple vs Samsung

detailed analysis of the financial report of apple and its benchmark Samsung will reveal the root of the problem leading to the low profitability of the firm.... The paper "DuPont Analysis: Apple vs Samsung" focuses on the critical analysis of the major issues on DuPont analysis of the companies Apple and Samsung.... apple Company is a leading world manufacturer and marketer of mobile phones, portable digital music players, and personal computers....
6 Pages (1500 words) Research Paper

Inventory and Service Costing

It has dug into a substantial fraction of apple's market share.... apple Inc.... apple Inc.... Since its incorporation on 3 January 1977, apple has grown tremendously in the industry in all parameters including revenue collections, market capitalization, and market share.... apple had 394 official retail stores in 14 nations in the world by November 2012 (USSEC, 2012).... It also maintains an online apple Store as well as the iTunes Store....
14 Pages (3500 words)

Risks Associated by Sources of Finance in China

The importance of reporting comprehensive information for the protection of the investors and the stakeholders has been analyzed with the analysis of past examples of financial fraud.... The general purpose of the financial statements has also been explained with the analysis of the key components reported in the various parts of financial statements.... The various financial concepts have been reviewed and linked with various examples in the analysis of financial statements and their purpose....
8 Pages (2000 words) Literature review

Current Issues in Financial Reporting

The paper 'Current Issues in financial reporting' is an affecting example of finance & accounting literature review.... The paper 'Current Issues in financial reporting' is an affecting example of finance & accounting literature review.... For example, assets managed or brokered by financial institutions as part of asset management and brokerage for clients.... In this case, sponsoring banks may provide liquidity support to SIVs that were not capable of sustaining their financing in the short-term financial markets....
6 Pages (1500 words) Literature review

Accounting Policies and Practices of Apple

The paper "Accounting Policies and Practices of apple" is a perfect example of a case study on finance and accounting.... The paper "Accounting Policies and Practices of apple" is a perfect example of a case study on finance and accounting.... The paper "Accounting Policies and Practices of apple" is a perfect example of a case study on finance and accounting.... apple Inc is an American multinational corporation that has its headquarters in Cupertino, California....
8 Pages (2000 words) Case Study

International Financial Reporting Standards Regulation in Apple Inc

The paper "International financial reporting Standards Regulation in Apple Inc" is a perfect example of a case study on finance and accounting.... The paper "International financial reporting Standards Regulation in Apple Inc" is a perfect example of a case study on finance and accounting.... The paper "International financial reporting Standards Regulation in Apple Inc" is a perfect example of a case study on finance and accounting.... apple Inc....
18 Pages (4500 words) Case Study

Consolidated Financial Reporting

The paper "Consolidated financial reporting" is a wonderful example of a research paper on finance and accounting.... The paper "Consolidated financial reporting" is a wonderful example of a research paper on finance and accounting.... The paper "Consolidated financial reporting" is a wonderful example of a research paper on finance and accounting.... The current events in Australia in trying to streamline financial reporting indicate that the group is contrivance over the individual legal status of the associated entities....
9 Pages (2250 words) Research Paper
sponsored ads
We use cookies to create the best experience for you. Keep on browsing if you are OK with that, or find out how to manage cookies.
Contact Us