StudentShare
Contact Us
Sign In / Sign Up for FREE
Search
Go to advanced search...
Free

The Gap Between Risk and Returns - Essay Example

Cite this document
Summary
The paper "The Gap Between Risk and Returns" states that the stock market works on capitalization which totally depends upon the economic situation of a country. There is no restriction on quoted firms in a stock exchange as every company can approach the primary and secondary stock markets…
Download full paper File format: .doc, available for editing
GRAB THE BEST PAPER98.8% of users find it useful
The Gap Between Risk and Returns
Read Text Preview

Extract of sample "The Gap Between Risk and Returns"

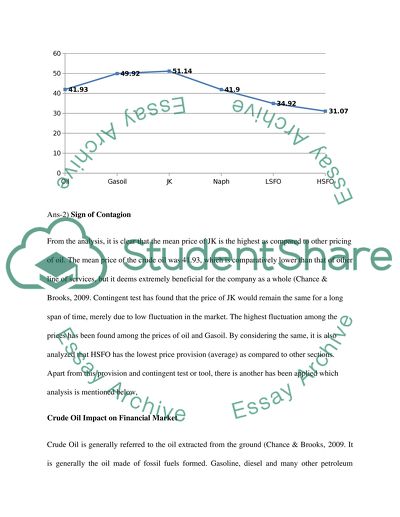
? Analysis GARCH Model Generalized Autoregressive Conditional Heteroskedasti (GARCH) is a popular model widely used to estimate stochastic volatility (Chance & Brooks, 2009). Its application on finance has been very successful over the years. The most important factor that plays a significant role in finance is the gap that lies between risk and return. GARCH effectively helps in analyzing this gap between risk and return and provides an in-depth analysis over asset pricing, portfolio optimization, option pricing and risk management (Christian Francq, 2011). GARCH model work on the assumption that randomness of the variance process fluctuates in accordance with the variance and not per its square root i.e (Chance & Brooks, 2009. standard deviation. GARCH model is used in mathematical finance for evaluating derivative securities. GARCH model works on the assumption that underlying volatility is consistent throughout the life of the derivative and do not respond in the changes of its price (Chance & Brooks, 2009. Ans-1) Six Series Co integrate In order to complete the same, we have to recognize and consider below mentioned table and graph,   Oil Gasoil JK Naph LSFO HSFO Mean 41.93075824 49.91961538 51.13502198 41.9046 34.92238 31.07245 Ans-2) Sign of Contagion From the analysis, it is clear that the mean price of JK is the highest as compared to other pricing of oil. The mean price of the crude oil was 41.93, which is comparatively lower than that of other line of services, but it deems extremely beneficial for the company as a whole (Chance & Brooks, 2009. Contingent test has found that the price of JK would remain the same for a long span of time, merely due to low fluctuation in the market. The highest fluctuation among the prices has been found among the prices of oil and Gasoil. By considering the same, it is also analyzed that HSFO has the lowest price provision (average) as compared to other sections. Apart from this provision and contingent test or tool, there is another has been applied which analysis is mentioned below, Crude Oil Impact on Financial Market Crude Oil is generally referred to the oil extracted from the ground (Chance & Brooks, 2009. It is generally the oil made of fossil fuels formed. Gasoline, diesel and many other petroleum products are its refined form. Financial markets are those places where organizations and individuals can trade commodities, securities in bulk. Financial markets have both specialized and general markets. In specialized market a single commodity is dealt where as general market trade different commodities (Chance & Brooks, 2009. A number of studies have been conducted over the relationship between crude oil and its impact on financial market in different regions and economies. These economies include both oil dominant and non oil dominant countries. As a result different interpretations were given by various researchers of their analysis conducted (Chance & Brooks, 2009. (Park, 2007) analyzed the impact of oil supply and demand gap and its impact on the real price of crude oil in stock market of U.S. The total impact of oil demand and supply is only on the one fifth of the stock market of U.S. It was found that the crude oil fluctuation in the international market has a greater impact on U.S. stock market (Chance & Brooks, 2009. Istemi Berk & Berna Aydogan investigated the impact made on Turkish stock market returns by the variations created in crude oil price. Vector autoregression model was applied on the secondary data of crude oil prices and National Stock Exchange of Istanbul Index (ISE-100) over 21 years of data between 1990 to 2011. The study also looks into the association between stock market returns and oil prices under global liquidity conditions (Chance & Brooks, 2009. The Turkish stock market was slightly influenced by the local prices and was greatly dependent on the global liquidity conditions (Crude Oil Price Shocks and Stock Returns: Evidence from Turkish Stock Market under Global Liquidity Conditions, 2012). Maghyereh & Al-Kandari investigated in order to examine the fluctuations that occur in GCC stock markets and their linkage with oil prices. It was found in their research when used a non linear regression model that there exists a relationship between oil prices and stock market in Gulf Cooperation Countries (Al-Kandari, 2007). Ans-3) Long Return The impact of crude oil price alterations in past decade has been observing to fluctuate the financial markets to a great extent (Forbes & Rigobon, 2002). The first bump in financial markets especially in commodity markets was observed in 2003 when U.S. attacked Iraq (Chance & Brooks, 2009. The supply of crude oil was greatly affected as the Arab world had his concerns over this war. As a result financial markets were found to be going up and down in terms of index points on a single day. Few companies were found to be gaining points and many loosing it on the same day. Another such crisis which raised the per barrel price up to $148 were in mid 2008 when the financial crisis was creeping its head outside the ground of world economy (Chance & Brooks, 2009. Mean return of the same has been analyzed with the below mentioned table and graph. The gain or loss of a security in a particular period, the return consists of the income and the capital gains relative on an investment. It is usually quoted as a percentage. The general rule is that the more risk you take, the greater the potential for higher return - and loss.     Oil   Gasoil   JK   Naph LSFO HSFO Mean   1.043828984   0.981049175   1.014674342   1.132985 1.319173 1.484782 The average return rate of oil is 1.04%, which is somewhat similar to Gasoil and JK which have a mean return of 0.98% and 1.014% respectively. Apart from these figures and provisions, the mean figures of NAPH, LSFO and HSFO are 1.13%, 1.319% and 1.48% respectively. The highest return rate has been found in the analysis of HSFO, which is showing that it will facilitate its customers and shareholders more than any other company taking into account for the same (Chance & Brooks, 2009. Ans-8 Ans-7) Long return Series Analysis Volatility is the measure of price variation in a financial instrument with the passage of time. In other words it is the measure of the uncertainty of risk that could occur in a security in terms of the degree and size (Chance & Brooks, 2009. If the volatility of a security is high it means its value can be spread over a large range and it should be anticipated that the value of security will fluctuate to a large extent either positively as well as negatively (Chance & Brooks, 2009. A lower volatility refers that the value of the security can change only to a certain extent no matter the factors governing that security are highly influential (Christian Francq, 2011). One measure of volatility is the value of Beta which estimates the overall volatility of a security return over the return of benchmark set for that security return (Forbes & Rigobon, 2002).   Oil Gasoil JK Naph LSFO HSFO SD 31.86032353 36.7828222 37.57927449 29.78082 28.53909 27.19832 Standard Deviation is yet another important tool use to analyze the deviation from the mean and the volatility as well (Forbes & Rigobon, 2002). This particular tool has its own recognition and important for a long span of time. There are six different provisions also have been taken into consideration for the same and all of the things are important from the aspect of the company (Chance & Brooks, 2009. The standard deviation of Oil is 31.86%, which means there is nearly 32% chance that the mean figure of oil mentioned and computed above would not be achieved accordingly. The analysis has been found in the below mentioned figure According to the estimation, JK which has the highest mean density and value also have the highest volatility rate as compared to any other oil price in total. JK has a standard deviation of 37.57%, which Is the highest as compared to any other provision, while HSFO has the lowest SD as compared to any other thing which is showing that the association of probability of HSFO’s mean is quite low as compared to any other provision and thing in total. Apart from this, NAPH and LSFO also have quite low provision of SD which is quite a good sign from a company or sector, showing that it is operating under low risk provision. Ans-8 A market in which financial products buy and sell is referred as financial market (Steve & Maggy, 2008). The essence of financial market is extremely important from the standpoint of an economy (Timothy & Gaplin, 2002). No country can grow economically without establishing and developing its financial market. Financial market of a country is the only main source to attract foreign direct investment (FDI). Currently, every country has its own financial market usually referred as Stock Exchange or foreign exchange market (Timothy & Gaplin, 2002). There is a strong relationship between bank’s operations and financial markets because the banks usually invest the deposits in the financial markets to generate economic profit (Timothy & Gaplin, 2002). Stock Market works on capitalization which totally depends upon the economic situation of a country. There is no restriction of quoted firms in a stock exchange as every company can approach the primary and secondary stock market (Timothy & Gaplin, 2002). Likewise banks, stock market also has a major markets and lots of regional markets works in different parts of the country. In a stock market, investors buy and sell shares of the companies to earn profit. There are different categorizes of stock market which are low profile companies and blue chip companies (Timothy & Gaplin, 2002). Blue chip shares are those shares which give high amount of dividend to its shareholders. Investors always try to buy these shares because it will certainly increase the proportion of earning of the investor (Timothy & Gaplin, 2002). Blue Chip has very low chance of default, thus it can be said that investment in blue chip shares is risk free (Richards, 1995). The current economic crisis, which started in September 2007 engulfed all the big companies and industries in its fatal claws. Banking industry was the real victim of the economic crisis but financial market had also hit extremely hard due to that (Timothy & Gaplin, 2002). The crisis which referred as sub prime mortgage crisis bought horrible result for the entire financial market of the world. New York Stock Exchange (NYSE) and National Association of Security Deals Automated Quotation (NASDAQ) are the biggest stock markets of the world and both the markets had effected seriously from the current economic downturn and resultantly millions of investors put out their investment from the market (Timothy & Gaplin, 2002. Different things have different provisions on the rest of the things and oil provision is one of them. References Al-Kandari, A. M. (2007). Oil prices and stock markets in GCC countries: new evidence from nonlinear cointegration analysis. Managerial Finance , 449 - 460. Christian Francq, J.-M. Z. (2011). GARCH Models: Structure, Statistical Inference and Financial Applications. John Wiley & Sons. Crude Oil Price Shocks and Stock Returns: Evidence from Turkish Stock Market under Global Liquidity Conditions. (2012). EWI Working Paper , 157-172. Park, L. K. (2007). The Impact of Oil Price Shocks on the U.S. Stock Market. JEL Classification , 1-41. Chance, D & Brooks, R (2009), Introduction to Financial Institutions, Prentice Hall Publications Chisholm, A, (2010), Introduction to Financial Institutions, Pearson Group Publications Donald, J, (2004), Introduction to Financial Institutions, Oxford University Publications Kumar, A (2004), Introduction to Financial Institutions, Pearson Group Publications Forbes, K & Rigobon, R (2002), No Contagion, Only Interdependence, Measuring Stock Market Co-Movements, Journal of Finance Taylor, F, (2007), Introduction to Financial Institutions, McGraw Hill Publications Whaley, R (2006) Derivative Market: Valuation & Risk Management, New York, John Wiley & Sons Professional Publications, Rob, J (2008) Forecasting with exponential smoothing, New York, McGraw Hill Publications, Jerry, W (1964), Exponential Smoothing, London, Oxford Publications Morgan, F & Stanley, A (2007), Financial Markets, McGraw Hill Publications Richards, A (1995), Co movements in National Stock market Returns: Evidence of Predictability but not Co-integration, International Monetary Fund Publications Steve, M & Maggy, K (2008), Financial Markets:Introduction, Pearson Group Publications Timothy, J & Gaplin, M (2002), Purchasing Power Parity, John Wily & Sons Professional Publications Zammer, J (2010), Financial Market & Crisis, John Wily & Sons Professional Publications Read More
Cite this document
  • APA
  • MLA
  • CHICAGO
(“Finance Essay Example | Topics and Well Written Essays - 2000 words”, n.d.)
Finance Essay Example | Topics and Well Written Essays - 2000 words. Retrieved from https://studentshare.org/finance-accounting/1471560-finance
(Finance Essay Example | Topics and Well Written Essays - 2000 Words)
Finance Essay Example | Topics and Well Written Essays - 2000 Words. https://studentshare.org/finance-accounting/1471560-finance.
“Finance Essay Example | Topics and Well Written Essays - 2000 Words”, n.d. https://studentshare.org/finance-accounting/1471560-finance.
  • Cited: 0 times
sponsored ads
We use cookies to create the best experience for you. Keep on browsing if you are OK with that, or find out how to manage cookies.
Contact Us