StudentShare
Contact Us
Sign In / Sign Up for FREE
Search
Go to advanced search...
Free

Profitability ratios in financial ratio analysis - Essay Example

Cite this document
Summary
Ratio Analysis is a popular technique which helps in analysing a company’s performance over a given period of time.Although this technique has some limitations, it is broadly used around the world in analysing the performance of different organisations…
Download full paper File format: .doc, available for editing
GRAB THE BEST PAPER98.8% of users find it useful
Profitability ratios in financial ratio analysis
Read Text Preview

Extract of sample "Profitability ratios in financial ratio analysis"

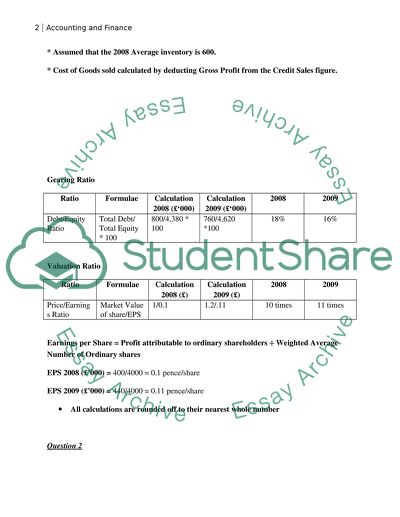
?Accounting and Finance Question Profitability Ratios Ratio Formulae Calculation 2008 000) Calculation 2009 000) 2008 2009 Gross Profit Margin Gross Profit ? Sales * 100 (3,600 ? 12,000) * 100 (4,600 ? 13,200) * 100 30% 35% Liquidity Ratios Ratios Formulae Calculation 2008 (?‘000) Calculation 2009 (?‘000) 2008 2009 Current Ratio Current Assets ? Current Liabilities (600 + 400 + 200) ? 1,400 (640 + 480 + 160) ? 1,520 0.86 : 1 0.84 : 1 Acid Test Ratio (Current Assets – Inventory) ? Current Liabilities (400 + 200) ? 1,400 (480 + 160) ? 1,520 0.43 : 1 0.42 : 1 Efficiency Ratios Ratios Formulae Calculation 2008 (?‘000) Calculation 2009 (?‘000) 2008 2009 Receivable Turnover Ratio Total Receivables/Credit Sales * 365 400/12,000 * 365 480/13,200 * 365 12 days 13 days Average inventory turnover period Average Inventory/Cost of Goods Sold * 365 600/8,400 * 365 {(600+640)/2} ? 8,600 * 365 26 days 26 days * Assumed that the 2008 Average inventory is 600. * Cost of Goods sold calculated by deducting Gross Profit from the Credit Sales figure. Gearing Ratio Ratio Formulae Calculation 2008 (?‘000) Calculation 2009 (?‘000) 2008 2009 Debt/Equity Ratio Total Debt/ Total Equity * 100 800/4,380 * 100 760/4,620 *100 18% 16% Valuation Ratio Ratio Formulae Calculation 2008 (?) Calculation 2009 (?) 2008 2009 Price/Earnings Ratio Market Value of share/EPS 1/0.1 1.2/.11 10 times 11 times Earnings per Share = Profit attributable to ordinary shareholders ? Weighted Average Number of Ordinary shares EPS 2008 (?’000) = 400/4000 = 0.1 pence/share EPS 2009 (?’000) = 440/4000 = 0.11 pence/share All calculations are rounded off to their nearest whole number Question 2 As per the Income Statement and the Balance Sheet, the company seems to be a very good profitable organisation but a mere look upon these two financial statements do not give a decisive position about a company’s performance, hence proper analysis needs to be done. Ratio Analysis is one of the popular technique which helps in analysing a company’s performance over a given period of time. Although this technique has some limitations, it is broadly used around the world in analysing the performance of different organisations around the world. The performance of Uffington Plc is analysed by using the ratio analysis technique. The ratio analysis uses different types of ratio which are based upon different aspects of performance in a company and finally a company’s performance is evaluated under all those different ratios. “Profitability ratios show a company's overall efficiency and performance. We can divide profitability ratios into two types: margins and returns. Ratios that show margins represent the firm's ability to translate sales pounds into profits at various stages of measurement. Ratios that show returns represent the firm's ability to measure the overall efficiency of the firm in generating returns for its shareholders” (About.com). Gross Profit Margin ratio is a profitability ratio which reveals the amount of gross profit as a percentage of the sales revenue. Uffington plc’s Gross Profit Margin has improved from 30% in 2008 to 35% in 2009. This indicates that the company has improved its performance during the year 2009 but if these results are compared with the industry average trends for Uffington plc, the company has not performed although the company is trying to achieve the industry average gross profit margin of 50%. Uffington plc would need to increase its revenue or cut its costs dramatically to reach the industry average gross profit margin of 50%. Liquidity ratios are a measure of ascertaining the day to day running of a company; it is merely a measure of ascertaining a company’s ability to pay off its obligations as they fall due. These obligations are generally the current liabilities and these current liabilities can be met by having appropriate current assets. The current ratio is a measure that analyses a company’s ability to pay off its current liabilities by negotiating its current assets. Uffington plc current ratio has deteriorated in the year 2009. It has reached a ratio of 0.84:1 from being 0.86:1 in 2008. The industry average current ratio on the other hand is a very high ratio of 2.54:1. This clearly suggest that Uffington plc’s current ratio is way below the industry average and needs greater monitoring and control so as to improve the current ratio. The Acid Test ratio on the other hand for Uffington plc is also way below the industry average of 1.87:1. The industry average clearly suggests that companies operating in the same sector as Uffington plc have kept high liquidity ratios. This shows that Uffington plc might face severe bankruptcy issues if it does not improve its liquidity position. The efficiency ratios suggest how well a company has performed with respect to the usage of the assets that they have owned. The average settlement period for trade receivable in Uffington plc is 12 and 13 days for the year 2008 and 2009 respectively. This suggests that Uffington plc have paid up their debtors’ way before than they are usually required to. The debtor management is really fast within Uffington plc i.e. debtors get paid really quickly. The industry average suggests that companies in the same sector as Uffington plc take up to an average of 28 days before settling up their respective debtors. The inventory turnover ratio on the other hand shows the ability of a company to sell and replace its inventory in a given time period (usually a year). The inventory turnover ratio for Uffington plc is very good and it takes them 26 days to sell and replace their inventory in a year and this result is way better than the industry average inventory turnover figure which is 36 days. This clearly shows that the company can improve its working capital cycle and its liquidity position by proper application of working capital management. The gearing ratio identifies the mix of different sources of finance employed by any given company. A proper mix of debt and equity finance leads to better performance of a company. Gearing is an essential element which helps in deciding upon the balance between equity and debt financing. The more highly a company is geared, the more difficult it would be for the company to raise further debt finance as high level of gearing denotes that the company is highly involved in debt financing. Hence it is better to keep a balance between the two different sources of finance. The gearing ratio calculated for Uffington plc is based upon the Total Debt/Total Equity ratio, hence it is assumed that the industry average gearing ratio is also calculated the same way. The industry average gearing ratio (70%) is way above the gearing ratio of Uffington plc (18% in 2008 and 16% in 2009). This reduction in the gearing ratio is clearly seen through the balance sheet as the non-current liabilities for Uffington plc are reduced from ?800,000 in 2008 to ?760,000 in 2009. The company is heavily involved in equity financing, hence it is forgoing the cheaper form of financing i.e. debt financing. The P/E ratio measure the price paid for a share of a company, as compared to the earnings of that company. The P/E ratio for Uffington plc has increased from 10 times in the year 2008 to 11 times in 2009. The industry average P/E ratio for Uffington plc is 10 times, hence it can be said that the company is performing well and has good prospects in the future because of its increasing P/E ratio. (McLaney et al, 2008) Question 3 With respect to the data available, the company seems to be a bit risky as there are chances that the improper working capital management and the reduced gearing effect may in fact lead the company in a state of dismay. The liquidity ratios for Uffington plc suggest that the company might face some bankruptcy issues in the near future if the company does not respond quickly to these issues. Hence it may seem appropriate not to invest in a company that may face liquidation in the near future and that too because of a fault on behalf of improper management by the company. Such liquidity ratio has also been created because of the improper management of the working capital cycle. The industry average period to settle off trade receivables is 28 days and Uffington plc settles them off in 12 to 13 days, this suggests that the company does not uses that particular cash in other activity, rather it pays off its debtors before they actually fall due. (Although it is better to pay off debtors before due dates to avail huge discounts but in Uffington plc’s case this does not seems to be the case). Secondly, the reduced gearing ratio illustrates that the company’s managements is focused towards equity financing rather than debt financing, hence such approach of the company may lead to the dilution of the shares of the company for Kathryn. This dilution of shares would reduce the value of the share for Kathryn; hence it would be better not to invest in any such company. The company’s reduced gross profit margin figure is a also an alarming figure for any investor like Kathryn because the industry average is higher than the gross profit margin figure of Uffington plc. The higher gross profit margin in the industry may lead Kathryn to invest in those companies rather than Uffington plc. The return that Kathryn would be expecting from the company would be the dividend that she would be entitled to. The percentage return on the investment made by Kathryn should be calculated by the dividing the yearly dividends with the investments. This way the percentage return on investment would get known and this percentage return can then be compared to returns offered by other investments such as banks or other financial institutions. The banks interest rates on borrowing would be needed to ascertain the higher return offered by the two (The bank or Uffington plc) Further information may be needed to evaluate the scenario in depth. This information includes the investment amount to be made by Kathryn to buy the shares, the return offered by banks and the dividend payout ratio (which seem fixed to ?200,000 even though the profits have increased in 2009). The personal appetite of the investor must also be known to analyse such investment situations, a high risk taker would end up getting higher reward because of the excess risk that he/she faces whilst on the other hand, a low risk take would get a mild return on any investment. Except these issues, the company seems to be a good venture to invest in, if these issues are dealt appropriately by the management of Uffington plc, the company may turn into a very profitable venture for Kathryn and it would be really fruitful to buy the shares of Uffington plc. The P/E ratio is clearly higher than the industry average and it seems that the company has greater prospects not only for its current shareholders but also for any potential shareholders. Hence under the current circumstances that are currently happening within the organisation, it is better for Kathryn not to invest in the company and keep her money intact within a bank. The advantage that is clearly evident of doing such a thing is the increased security of the funds being kept within a bank and earning a nominal return rather than keeping those funds invested in such an unstable company. References About.com: Business Finance, Use Profitability Ratios in Financial Ratio Analysis, by Rosemary Peavler http://bizfinance.about.com/od/financialratios/a/Profitability_Ratios.htm McLaney, E. J., & Atrill, P. (2008). Accounting: An introduction. Harlow: Financial Times Prentice Hall. Read More
Cite this document
  • APA
  • MLA
  • CHICAGO
(“Profitability ratios in financial ratio analysis Essay”, n.d.)
Retrieved from https://studentshare.org/finance-accounting/1407056-profitability-ratios-in-financial-ratio-analysis
(Profitability Ratios in Financial Ratio Analysis Essay)
https://studentshare.org/finance-accounting/1407056-profitability-ratios-in-financial-ratio-analysis.
“Profitability Ratios in Financial Ratio Analysis Essay”, n.d. https://studentshare.org/finance-accounting/1407056-profitability-ratios-in-financial-ratio-analysis.
  • Cited: 1 times

CHECK THESE SAMPLES OF Profitability ratios in financial ratio analysis

Managing Operations and Finance

Moving forward, the paper presents a comparison of the current and last year financial performance of the company through financial statement ratio analysis.... The primary reason to conduct a ratio analysis is to quantify the results of the operations of a company and compare them with that of the prior year(s) in order to assess different aspects of the financial feasibility.... The paper identifies the areas, through ratio analysis, where the company is performing well and where it needs improvements....
10 Pages (2500 words) Essay

Estimation of the Equity Value of the Company

Answer to Question 2 ratio analysis is a very accurate and reliable tool when it comes to analyzing the financial outlook of an entity.... The primary reason to conduct a ratio analysis is to quantify the results of the operations of a company and compare them with that of the prior year(s) in order to assess different aspects of... There are two approaches through which this analysis can be made.... There are several step of equity valuation process and it requires an adequate understanding of financial management techniques and acumen....
13 Pages (3250 words) Essay

Financial Status of Simon Everly Plc

hellip; The financial ratios interpreted in this section include: all the liquidity ratios, some of profitability ratios (Return on equity and return on capital employed), gearing ratios, interest cover, and some of the investors ratio.... Simon Everly PLC Financial analysis and decision making Tutor Institution Date QUESTION B: FINANCIAL STATUS OF SIMON EVERLY PLC In this section of financial analysis we will not discuss all the financial ratios calculated in question A (calculations in Appendix 1), but we will only interpret the financial ratios that are capable of showing us the financial status of Simon Everly PLC....
10 Pages (2500 words) Essay

Comparing Coca-Cola Enterprise and Pepsi Co. Financial Management

Profitability Ratios are the most frequently used tools of financial ratio analysis and is used to determine the company's bottom line.... profitability ratios depict that how well a business is performing in terms of profit.... If an entity has to attract investors , the owners have to show some attractive profits to lure them into investing and for that the profitability ratios are the key.... Company's overall efficiency and performance is shown by the profitability ratios and one can easily compare financial information available for two or three companies to ensure the worth of each after making and investment....
4 Pages (1000 words) Research Paper

The Financial Outlook of Burke Company

Company Analysis ratio analysis is a very accurate and reliable tool when it comes to analyzing the financial outlook of an entity.... The primary reason to conduct a ratio analysis is to quantify the results of the operations of a company and compare them with that of the prior year(s) in order to assess different aspects of the financial feasibility.... profitability ratios identify how efficiently and effectively a company is utilizing its resources and how successful it has been in generating a desired rate of return for its shareholders and investors....
9 Pages (2250 words) Coursework

Using a Large Number of Ratios to Perform a Complete Ratio Analysis of a Firm

hellip; The ratio analysis forms an integral part of the financial statement analysis, especially from the investor's point of view, who always strive to invest in countries having strengthened and stabilizing financial ratios and representing an upward trend.... The ratio is calculated by dividing the sales revenue by the gross profit.... The ratio is calculated by dividing the profit before interest and tax with the sales revenue of the current financial period....
4 Pages (1000 words) Essay

The Ratio and Trend Analysis of a Company

in the report a detailed ratio analysis has been with the help of the information from the Income… Later on, the same has been compared with its competitor Universal Corporation.... To do the analysis about the current situation of the company a ratio analysis has been performed over the 3 years financial data of the companies.... We shall now discuss the various ratios in detail.... The various ratios that have been calculated are profitability ratios, Asset utilization Ratios, Liquidity (Solvency) Ratios, Debt Utilization Ratios and Market Value Ratios....
18 Pages (4500 words) Research Paper

Assignment 5: Financial Management

Current ratio is a popular financial ratio that is used to test the company's liquidity (liquidity is also referred to as the working or the current capital position of the company).... profitability ratios just like the operational performance ratio give the users a better understanding of how well the company utilizes its resources in order to generate shareholder value and profit.... The profitability ratios as stated earlier indicates the how well the company has utilized its resources in order to generate shareholder value and profit....
5 Pages (1250 words) Essay
sponsored ads
We use cookies to create the best experience for you. Keep on browsing if you are OK with that, or find out how to manage cookies.
Contact Us