StudentShare
Contact Us
Sign In / Sign Up for FREE
Search
Go to advanced search...
Free

Effects of Oil Price Fluctuations on the UK Economic Growth - Dissertation Example

Cite this document
Summary
The paper "Effects of Oil Price Fluctuations on the UK Economic Growth" focuses on the critical analysis of how oil price fluctuations affect the UK economic growth in 1970-2009. Various literature and research studies on the effects of fluctuating oil prices have led to varied findings…
Download full paper File format: .doc, available for editing
GRAB THE BEST PAPER94.9% of users find it useful
Effects of Oil Price Fluctuations on the UK Economic Growth
Read Text Preview

Extract of sample "Effects of Oil Price Fluctuations on the UK Economic Growth"

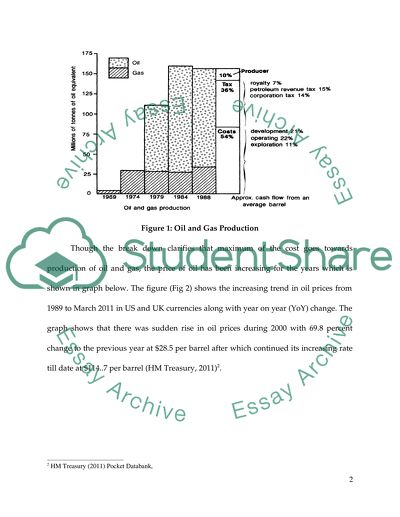
?Results and Analysis Various literatures and research studies on the effects of fluctuating oil price have led to varied findings. There is no doubtthat oil is necessary to drive the economy of any national, but its fluctuating price has left most of the nation with no other option but making the lives of people more costlier. Changes in oil prices have been associated with major developments in the world economy and are often seen as a trigger for inflation and recession. It should be noted that increase in oil prices in 1974 and 1979 were important factors in producing a slowing down in the world economy at a time when inflation was rising. The recent upsurge in oil prices and unrest in oil rich countries for the past few months has resulted in rapid increase in the oil price send shockwaves globally affecting the major GDP nations. However, it is argued that the recent increases in oil prices can be altered as compared to the slowdown occurred in 1970s (Barrell and Pomerantz, 2004). Before making any analytical statements, it is necessary to find the costs involved in production of oil and gas. The figure below shows the oil and gas production statistics from 1969 to 1988 with breakdown of cash flow for each barrel of oil purchased. It is shown in the figure (Fig.1) below that out of the total cost required for oil and gas production, 10 percent of the share goes to the producer, 36 percent towards tax which includes 7% royalty, 15% petroleum revenue tax and 14% corporation tax; and remaining 54 percent of costs towards development, operation and exploration charges (Band, 1991)1. Figure 1: Oil and Gas Production Though the break down clarifies that maximum of the cost goes towards production of oil and gas, the price of oil has been increasing for the years which is shown in graph below. The figure (Fig 2) shows the increasing trend in oil prices from 1989 to March 2011 in US and UK currencies along with year on year (YoY) change. The graph shows that there was sudden rise in oil prices during 2000 with 69.8 percent change to the previous year at $28.5 per barrel after which continued its increasing rate till date at $114..7 per barrel (HM Treasury, 2011)2. Figure 2: Increase in oil prices from 1989-2010 Since there has been continuous increase in oil price and its components, its effects on the economy of the United Kingdom is analyzed in this chapter by using the information available in HM Treasury and Peak Oil Task Force. The analysis is presented in graphical form and data is made available through tables within the text when and where required. Results According to International Energy Agency, consumption of fuel oil has drastically reduced from 1972 to 2008 whereas middle distillates and gasoline products have increased (www.iea.org). The first report of the Industry Taskforce on Peak Oil Energy Security (ITPOES) 2008 highlights the probability that future oil production volumes are unlikely to rise much above the record global extraction rate of 87Mb/d. The report further forecasts probability of future oil crunch which lasting impact on the world and UK economy. Figure 3: UK energy production and consumption 1970 to 2009 According to figure 3, consumption of oil has remained constant whereas the rate of production has been increasing continuously during the same period stating great demand (Dukes, 2010). The figure (Fig.4) shows that oil price has remained constant for most of the time from 1920 to 1970 below $30 per barrel after which there was rapid increase in the prices. The significant rise in prices over past decade presents a cause for concern which may represent a turning point in the history of oil production, the point where the highest practicable rate of global production has now been achieved and from which future levels of production will either plateau or begin to diminish. According to the report, Industry Taskforce on Peak Oil Energy Security, the global rate of production has been moving upwards indicating an existence of huge resources (ITPOES, 2010). According to DECC (2010) the prices paid by domestic customers for all fuel and light rose by 4.7 per cent in real terms whereas domestic electricity prices, including VAT, rose by 3.0 per cent in real terms. Domestic gas prices, including VAT, rose by 12.1 per cent in real terms during the same period prices for domestic coal and smokeless fuels rose by 15.9 per cent in real terms. The price of domestic heating oil has decreased by 24.4 per cent and petrol and oil prices fell by 9.3 per cent between 2008 and 2009. Provisional data for 2009 shows that over the past five years (2004 to 2009), average industrial electricity prices have risen by 133 per cent (107 percent in real terms), with an increase of 7 per cent (5 percent in real terms) in the last year. Over the same period average industrial gas prices have increased by 99 per cent (77 percent in real terms), with a decrease of 9 per cent (11 percent in real terms) over the last year (DECC, 2010). Motor fuel prices increased at a steady rate from the Gulf crisis in 1990/91 to 2000, chiefly as a result of duty changes (Figure 7). Compared to 2008, the average price of ULSP in 2009 has decreased by 7.3 per cent, whilst the price of diesel has decreased by 11.6 per cent (Table-1). Table 1: Average annual retail prices of petroleum products and a crude oil price index: United Kingdom   4 star/ LRP(2)(8) Super unleaded Premium unleaded Diesel Standard grade burning oil Gas oil Crude oil acquired by refineries Pence per litre 2005 = 100 1978 16.77 .. .. 18.46 8.39 8.42 .. 1979 22.66 .. .. 23.65 10.89 10.9 .. 1980 28.32 .. .. 29.67 14.78 14.77 .. 1981 34.29 .. .. 34.01 18.01 17.51 .. 1982 36.62 .. .. 35.86 20.75 20.11 .. 1983 39.28 .. .. 37.3 21.19 20.71 .. 1984 40.62 .. .. 38.33 19.67 20.44 .. 1985 43.14 .. .. 41.94 21.12 21.58 .. 1986 37.35 .. .. 35.6 13.95 13.77 .. 1987 37.9 .. .. 34.58 12.55 13.16 .. 1988 37.38 .. .. 34 10.65 10.88 .. 1989 40.39 .. 38.29 36.18 12.04 11.64 .. 1990 44.87 .. 42.03 40.48 15.56 14.64 .. 1991 48.48 47.31 45.07 43.82 14.11 13.65 38.9 1992 50.28 48.38 46.07 45.01 13.06 12.49 36.7 1993 54.12 52.91 49.44 49.2 13.64 13.42 38.3 1994 56.87 55.98 51.58 51.53 13.37 13.27 35.1 1995 59.7 58.55 53.77 54.24 13.8 13.87 36.9 1996 61.63 63.67 56.52 57.71 15.93 16.53 45.3 1997 67.22 71.31 61.82 62.47 14.36 15.45 39.8 1998 71.11 77.8 64.8 65.5 11.25 12.47 26 1999 77.2 82.92 70.16 72.49 12.73 13.89 37.3 2000 84.89 87.32 79.93 81.34 20.57 21.51 63.8 2001 79.71 82.74 75.72 77.84 18.13 19.12 57.4 2002 77.03 79.79 73.24 75.46 15.66 15.93 55.4 2003 79.94 81.36 76.04 77.92 17.57 18.58 60 2004 84.42 85.75 80.22 81.91 21.26 21.96 69.6 2005 .. 93.4 86.75 90.86 29.03 30.53 100 2006 .. 98.05 91.32 95.21 33.66 36.58 118.4 2007 .. 100.4 94.24 96.85 35.03 40.03 122.6 2008 .. 113.47 107.08 117.51 51.05 58.42 175.5 2009 .. 105.71 99.29 103.93 36.15 44 131.9 Source: DECC Report, 2010 The chart (Figure 8) shows the trends in the production, exports and imports of crude oil. It shows that indigenous production of crude oil was negligible up to 1974 and then increased rapidly as North Sea production came on stream. Imports peaked in 1973, immediately prior to the first OPEC price ‘hike’. The chart shows the rapid decline of net imports thereafter as indigenous production rose, until 1981 when the surplus turned from net imports to net exports. Net exports first peaked in 1986, one year after the first peak for North Sea production in 1985. The large fall in production in 1988 and particularly 1989 reflects the effects of the Piper Alpha disaster and subsequent incidents, and the continued ‘low’ production in 1990 and 1991 reflects the consequent safety work. Production has been declining since the peak production of 137 million tonnes in 1999. In 2009 production was 3 million tonnes lower than 2008 (DECC, 2010) trends in the production, exports and imports of crude oil. UK energy trade has gone through a number of clear cycles which were the result of discovery of new fuel reserves and changes in production/use patterns (Figure 9). The late 1970s and early 1980s saw the most dramatic change. The UK’s imports fell from almost 150 million tonnes of oil equivalent (TOE) in 1973 to 63 million in 1982. Exports went from 18 million TOE in 1975 to 103 million in 1984. This trend then reversed for a few years. Exports fell by 28% in the second half of the 1980s, but had increased to their earlier levels by 1994. The second half of the 1990s saw a further reversal as exports increased and imports remained static. Since then imports have increased to above the levels seen in the mid-1970s and exports have fallen by an even greater proportion than that seen in the late 1980s. The result is that net exports in 2007 and 2008 wuere around 60 million TOE the highest level since the mid 1970s (DECC, 2010). The graph below shows that from 1920 to 1960, Middle East, America and Europe were the main areas where oil production was carried out (Figure 10). After the crisis of 1970, oil rich nations were formed into coalition under different organizations resulting in abundant production oil compared to the production before 1970 period. On the basis of above graph, it is assumed that there is an abundant oil resource in the world resulting in ‘peak oil’ which means the maximum rate at which we can extract oil relating to ease of access and rates of extraction at the wells. Figure 10: Global oil production 1920-2008. (FSU: former Soviet Union, since December 1991.) (Sources: US Department of Energy for 1920-1964, and BP Statistical Review of World Energy for 1965-2008) United Kingdom is becoming increasingly exposed to competition for supplies from other energy importers due its net imports of oil, gas and coal which is likely to put pressure on the UK balance of payments and exchange rates of pound sterling. Oil prices stimulate the exploration and there have been dangerous shortfalls even when prices have been high. Oil is a key commodity with the UK economy and business activity is affected by large swings in the oil price and oil availability. The consequences of the very high oil prices and the shortages of supply in the 70s and 80s was that the national economy fell into recession (Figure 11). It is further mentioned in the Task Force analysis that high and volatile oil prices, couple with supply uncertainties is likely to become characteristics of future of world oil markets. Oil price uncertainties, in view of the recent recession, may result in delayed economic recovery of the United Kingdom. It is evident from the figure shown below that the annual growth of UK economy has come down below the neutral showing negative GDP during 1975, 1980 and 1999 whereas there is spurge in oil prices during the same period which makes it more clear that oil prices play an important role in developing the economy of any nation. Figure 11: UK annual GDP growth and oil price from 1960 to the present with periods of recession marked by shading. (Sources: ONS and BP Statistical Review) The possible shock to the UK economy of higher oil prices must be set in context. The present national consumption is better compared to 1970s and 80s. Oil is no longer used as significant source of electricity generation which is replaced by coal, nuclear and gas during the early 80s, precisely because of the oil price spikes and availability uncertainties which dominated that period. It is further reported that national supply is depleting as North Sea oil was just coming on stream in the 70s which turned the United Kingdom into an oil exporter for the next 25 years which came to an end with UK once again becoming the net importer of oil. The figure below shows that the United Kingdom had used its abundant resources producing nearly 1500 kb/day which was used for indigenous purpose. However, it is depicted in the chart that the United Kingdom started importing oil as their oil reserves depleted by the time (Figure 12). Figure 12: UK production of primary fuels 1970 to 2009 In 1970, total energy production was around 111 million tonnes of oil equivalent with coal accounting for some 84 per cent. From 1975, petroleum production also grew rapidly to peak at over 139 million tonnes of oil equivalent in 1985 when it accounted for 55 per cent of the total energy production of 252.5 million tonnes of oil equivalent. By 1991, temporary production problems had reduced petroleum production to 100 million tonnes of oil equivalent. Since then petroleum production steadily recovered, reaching a record level of 150 million tonnes of oil equivalent in 1999. Between 1999 and 2006 production of petroleum fell by 44 per cent. Production levels stabilised in 2007 as output from new fields (Buzzard) offset the general decline in production (DECC, 2010). The reversion to importing oil and the spike in world prices, represents an unpleasant double whammy for the UK economy. Despite the focus on renewable and alternative fuels, oil still turns the wheels of the transport sector wherein 97 percent of the transport energy consumption is petroleum products (Figure 13). Public transport operations depend on diesel to run their buses and coach networks and many of their rail services. People travel for business, social, domestic and pleasure purposes, and the sustained level of oil consumption associated with transport since 2000, despite improvements in engine efficiency. Manufacturing and retail businesses widely depend on just-in time business models, and transport is fundamental to this approach (Figure 15). This implies that the prices of most goods on the retail shelves have a significant transport component in their buildup, and availability on the shelves is acutely vulnerable to oil supply shortages. Thus, a hike in oil prices will quickly find its way through to the shelves and into people’s weekly shopping bills. A shortage of oil will likewise be quickly felt as a shortage of goods in the shops. The other sectors of the UK economy which have vital oil-based ingredients are farming and materials manufacturing, such as plastics. In both cases, while the absolute volumes of oil consumed are relatively small, but, in both cases, the prices of the products for sale in the shops are directly affected by the cost and availability of oil. Based on these evidence it assumed that UK government may witness supposed higher prices of all forms of travel, increased food prices, increased general retail prides, increased domestic utility bills for heating and power. Total uses by the transport sector are now roughly double the amount delivered in 1970 shown in figure corresponding to the above graph. Deliveries to every other major sector are below 1973 levels - well below for electricity generators, iron and steel and ‘other industries’, and other final users (mainly agriculture, public administration and commerce). Figure 15; Road Transport Consumption Figure 16: Oil Demand and Production Cap With the projections showing great demand for increase in oil production, it is inevitable that prices would remain stable but would increase at the rate of production. Similar estimates have been made by Global Insight wherein it is predicted that during the period between 2010 – 2015, a 30% increase in the world oil prices, equivalent to around $13 per barrel raises UK’s aggregate domestic energy price by 22% compared to the baseline, suggesting in part the other sectors of the UK economy which have vital oil-based ingredients are farming and materials manufacturing, such as plastics. In both cases, while the absolute volumes of oil consumed are relatively small, but, in both cases, the prices of the products for sale in the shops are directly affected by the cost and availability of oil. Table 2: Primary energy consumption, gross domestic product and the energy ratio(1970 to 2009)   Total inland consumption of primary energy Gross domestic product at market prices (2005 prices) Energy ratio     Million tonnes of oil equivalent ? billion Tonnes of oil equivalent per ?1 million GDP Index 1970 = 100   (A) (B) (C) 1970 211.9 544 389.5 100 1971 209.7 555.4 377.5 96.9 1972 212.6 575.7 369.3 94.8 1973 223.1 617.2 361.5 92.8 1974 212.4 609.1 348.7 89.5 1975 206 605.3 340.3 87.4 1976 208.9 621.2 336.3 86.3 1977 213.1 636 335.1 86 1978 213.7 656.5 325.5 83.6 1979 220 674.1 326.4 83.8 1980 206.2 660.1 312.4 80.2 1981 198.7 651.3 305.1 78.3 1982 196.3 665 295.2 75.8 1983 197.5 689.1 286.6 73.6 1984 196.7 707.5 278 71.4 1985 203.1 732.9 277.1 71.1 1986 206.8 762.4 271.3 69.6 1987 210 797.1 263.4 67.6 1988 217.7 837.2 260 66.8 1989 217.8 856.3 254.3 65.3 1990 221.6 863 256.8 65.9 1991 221.4 851 260.2 66.8 1992 220.6 852.3 258.8 66.5 1993 222.5 871.2 255.4 65.6 1994 221.5 908.5 243.8 62.6 1995 223.6 936.2 238.8 61.3 1996 227.1 963.2 235.7 60.5 1997 229.2 995.1 230.3 59.1 1998 236.8 1,031.00 229.7 59 1999 238 1,066.80 223.1 57.3 2000 239.6 1,108.50 216.2 55.5 2001 240.5 1,135.80 211.7 54.4 2002 237.3 1,159.60 204.6 52.5 2003 237.5 1,192.20 199.2 51.2 2004 240.2 1,227.40 195.7 50.3 2005 239.7r 1,254.10 191.2r 49.1r 2006 236.8r 1,289.80 183.6r 47.1 2007 232.5r 1,322.80 175.7r 45.1r 2008 226.3r 1,330.1r 170.2r 43.7r 2009 212.6 1,264.60 168.1 43.2 Source: DUKES, 2010, DECC The data collected from Department of Energy and Climate Change, United Kingdom, the total energy consumption has remained constant between 210-240 million tonnes of oil between 1970 and 2009 but the Gross Domestic Product (GDP) as market has increased on continuous basis (Table). The trend is clearly depicted in the chart below. Figure 17: Primary Energy consumption and GDP Growth The study investigates the relationship between oil prices and the other variables of the model, focusing on the significance of the impact of oil prices on real activity. Different tests for both linear and non-linear specifications are carried and Wald test statistic has been performed, which tests the null hypothesis that all of the oil price coefficients are jointly zero in the GDP equation of the VAR model. Table 3 below displays the p-values of the Wald test statistic, indicating that that the different oil prices variables are not statistically significant at a 5% critical level in most of the countries considered. This means that oil prices do not appear to have a significant direct impact on real activity. Table 3: Wald Test Linear Assymetric Scaled Oil Price Net Oil Price Ot Ot+ Ot- SOPIt SOPDt NOPIt 0.94260 0.49526 0.24439 0.28650 0.74116 0.20778 Further the effects of oil prices on GDP growth in terms of both orthogonalised impulse-response functions and accumulated responses for the linear and the non-linear specifications of the model are examined. Table 4 below presents the accumulated responses of GDP growth to an oil price shock normalised to correspond to a 1% increase in the linear model, while the last fifteen lines for each country reports those obtained in the non-linear models under study. In order to better understand the mechanisms behind the impulse and accumulated responses of GDP growth, we have analysed impulse and accumulated responses of other variables. It is found that one of the key channels playing a role in the effect of oil prices on real activity is related to the real effective exchange rate. Table 4: Accumulated Response of GDP growth to a 1% oil price shock Linear` Assymetric Scaled Oil Price Net Oil Price   ot + ot - SOPIt SOPDt   4 quarters -0.00227 .0013 +0.0244 -0.0007 0.032 0.00495 6 -0.01710 .0182 +0.0308 -0.0247 0.047 0.02557 8 -0.01744 .0131 +0.0406 -0.0178 0.0655 0.02313 10 -0.01880 .0152 +0.0433 -0.0228 0.0691 0.02581 12 -0.01769 .0138 +0.0376 -0.0218 0.0613 0.02288 Table 5 below presents the accumulated responses of REER to an oil price shock normalised to correspond to a 1% increase in the corresponding current oil price measure under study. It indicates that the accumulated responses of GDP growth to a positive oil price shock in the linear and non-linear models are qualitatively similar. The real effective exchange depreciation induced by the shock offsets only in part the negative impact on output growth predominant in these countries. This means that the UK exhibits a surprising behaviour: While it is expected that an oil price shock has positive effects on the GDP growth for a net oil exporting country, an oil price increase of 100% actually leads to a loss of British GDP growth rate of more than 1% after the first year in all specifications. An extensive literature has highlighted that this unexpected result has to do with the fact that oil price hikes led to a large real exchange rate appreciation of the pound. Indeed, in the UK the output loss of a 100% shock to oil prices increases from less than 2% in the asymmetric and linear approaches to above 2% in the net and scaled models. In particular, the British inflation and interest rates suffer from stronger positive adjustment and declines in the oil price variable are only significant in the UK, with this country behaving as one would expect from an oil importing country, i.e., showing an accumulated output gain of around 6% following a 100% decline in oil prices (Rodriguez and Sanchez, 2004). Table 5: Accumulated Response of the rate of change in REER to a 1% oil price shock Linear` Assymetric Scaled Oil Price Net Oil Price   ot + ot - SOPIt SOPDt   4 quarters +0.10651 +0.0821 -0.1558 +0 .0 958 -0 . 263 9 +0.12229 6 +0.12627 +0.1238 -0.1643 +0 .1 544 -0 . 273 6 +0.16783 8 +0.12513 +0.1268 -0.1068 +0 .1 691 -0 . 207 7 +0.16078 10 +0.10597 +0.0100 -0.0911 +0 .1 355 -0 . 175 5 +0.13835 12 +0.10134 +0.1027 -0.0860 +0 .1 390 -0 . 162 5 +0.13256 The table 6 describes the results for the three non-linear specifications, namely the asymmetric, scaled and net approaches at the same time, stressing the results obtained for the preferred model. While the linear model supposes that the effects of an oil price increase and those of a decline are totally symmetric, non-linear specifications allow for differential impacts of oil shocks of the same magnitude and opposite sign (Rodriguez and Sanchez, 2004). Table 6: Estimated Variance Decomposition at the 12-period horizon: Linear Case Innovation in GDP o Infl SR LR RW REER VAR (GDP) 74,21 5,94 4,11 3,96 4,61 3,10 4,07 VAR (o) 11,99 69,79 2,07 5,51 1,50 4,26 4,88 VAR (Infl) 11,56 8,03 58,61 7,66 1,90 9,89 2,36 VAR (SR) 5,68 6,98 2,59 75,44 1,95 2,74 4,62 VAR (LR) 2,09 13,89 4,34 28,16 44,88 3,29 3,36 VAR (RW) 18,65 7,36 17,90 8,93 3,12 41,50 2,55 VAR (REER) 5,34 5,49 5,82 12,68 12,75 1,91 56,02 The variance decompositions suggest that oil price shocks are a considerable source of volatility for many of the variables in the model. For real GDP, oil prices are together with short-term interest rates the largest sources of shock other than the variable itself for most of the countries. Innovations in short-term interest rates represent monetary shocks in our model. The contribution of oil prices and short-term interest rates to GDP variability ranges in most of the cases between 4% and 10% (Rodriguez and Sanchez, 2004). Conclusion Inspection of the confidence bands around impulse responses allows us to conclude that the non-linear models yield results that are comparably accurate. Moreover, the accuracy of impulse responses in the non-linear specifications tends to be higher than in the case of the linear model, the latter only appearing to dominate in the case of the UK. Our variance decomposition analysis indicates that oil price shocks are a considerable source of volatility for many of the variables in the model. Oil prices shocks are, together with monetary shocks, the largest source of variation other than the variable itself. Dissertation Conclusion According to the data collected from various government and departmental websites of energy like Department of Energy and Climate Change (DECC), HM Treasury, Industry Task Force on Peak Oil & Energy Security, the oil price had a dramatic effect on the UK economy as it effects all the factors need to run the economy. Data analysis has been carried out using linear and non linear model, asymmetric, and Vector Auto Regression (VAR) which shows that oil price had definite impact on the inflation rate as well as overall production and growth of the economy during the period 1970 to 2009. Upsurge in oil prices, extraction of oil limited to few countries, and ever increasing demand for oil in growing economies has created huge demand for oil which ultimately affects the nations GDP which was evident in the United Kingdom. However it is to mention that GDP of United Kingdom has been growing constantly whereas the primary energy consumption in the country has remained stagnant between 210 and 240 million tonnes of oil. Moreover, it is further mentioned that though the consumption has remain stagnant, oil prices have increased over the years from 1970 to 2009 increases the rate of inflation and decreasing the rate of economic growth. Analyzing the data from various sources and carefully reviewing the existing literature, oil prices have been the driving force of the economy reflecting various macroeconomic factors. References 1. Barrell, R and Pomerantz O (2004), “Oil Prices and the World Economy”, London, pp 1-28 2. Band, G.C. (1991) Fifty Years of UK Offshore Oil and Gas, The Geographical Journal, Vol. 157, No. 2, pp. 179-189 3. HM Treasury (2011) Pocket Databank, 4. DECC (2010) Quarterly Energy Prices, Department of Energy and Climate Change, http://www.decc.gov.uk 5. DECC (2010) Energy: its impact on the environment and society, Department of Energy and Climate Change, http://www.decc.gov.uk 6. ITPOES (2010) The Oil Crunch: A wake-up call for the UK economy: Industry Taskforce on Peak Oil & Energy Security, Second report of the UK Industry Taskforce on Peak Oil & Energy Security (ITPOES), www.peakoiltaskforce.net 7. Rodriguez and Sanchez, (2004) Oil price shocks and real GDP growth empirical evidence for some OECD countries, European Central Bank, Working Paper Series, Germany Read More
Cite this document
  • APA
  • MLA
  • CHICAGO
(“How oil price fluctuation/shock effect United Kingdom economic growth Dissertation”, n.d.)
Retrieved from https://studentshare.org/family-consumer-science/1416989-how-oil-price-fluctuation-shock-effect-united
(How Oil Price fluctuation/Shock Effect United Kingdom Economic Growth Dissertation)
https://studentshare.org/family-consumer-science/1416989-how-oil-price-fluctuation-shock-effect-united.
“How Oil Price fluctuation/Shock Effect United Kingdom Economic Growth Dissertation”, n.d. https://studentshare.org/family-consumer-science/1416989-how-oil-price-fluctuation-shock-effect-united.
  • Cited: 0 times

CHECK THESE SAMPLES OF Effects of Oil Price Fluctuations on the UK Economic Growth

How much volatility is the Saudi Arabian petrochemical industry exposed to

However, oil prices are susceptible to high degrees of fluctuations, which is the reason why it is important to assess the extent of volatility that the industry is exposed to.... The nation's huge oil reserves have assisted it in getting developed as one of the largest producers and exporters of petroleum and petrochemical goods.... This high degree of dependence of Saudi Arabia upon its oil reserves bore fruit to the nation during the Arab-Israeli war of 1973 which increased oil prices to a peak thus facilitating the process in which Saudi Arabia became one of the fastest growing economies in the world (U....
84 Pages (21000 words) Dissertation

Transportation Cost Fluctuation Due to Changing Crude Oil Prices

to the uk, he or she must use either air or ship as a means of transport to reach the destination.... hellip; The level to which fuel price fluctuations as affected by global demand for oil, which in turn affects transport costs can only be explained using supply and demand theories.... The level to which fuel price fluctuations as affected by global demand for oil, which in turn affects transport costs can only be explained using supply and demand theories....
12 Pages (3000 words) Essay

Extent to Which the Theory of Exchange Rates Explain the Performance of the US Dollars

Name of the student: Tutor: Extent to which the theory of exchange rates explain the performance of the US$ in recent years Introduction Exchange rates can be the value, worth or price of a country's money with respect to another country.... In essence, during times of inflation pressure, the MPC would prefer a comparatively elevated rate given that this would lessen the price of import commodities and services and also will always help in absorbing the... Exchange Rate Policy The exchange rate based on any country's economy impacts either negatively or positively the aggregate demand via its effects on imports, exports and the extent at which policy makers can exploit this correlation....
16 Pages (4000 words) Essay

An Investigation of the Impact of Oil Price Changes on the Gulf Council Countries (GCC) Stock Markets

hellip; The dissertation, An Investigation of the Impact of oil price Changes on the GCC Stock Markets, aims to investigate the impact of oil price fluctuation upon the stock market index of the GCC countries over the last five years.... The dissertation aims to investigate the impact of oil price fluctuation upon the stock market index of the GCC countries over the last five years.... This paper seeks to identify and analyse the relationship of oil prices to the stock markets of the GCC, which stands for Gulf cooperation council....
64 Pages (16000 words) Dissertation

The Total Output of Employment and Income Level

After a decade, in 1991 a ‘boom and bust' of the uk economy ensued.... In the Great Depression of the 1930s which included the uk, the famous economist Keynes debunked this concept and contended that negative output over a period will not necessarily clear out on its own as was regarded by the notion of the self-correcting aspect of a free economy.... growth was seen at rapid growth that became unsustainable that inflation rose to 10%....
3 Pages (750 words) Essay

UKs Economic Issues

Question 1a Unemployment in the uk economic Performance for the Past Five Years The state of unemployment in any given country has a number of impacts in a country's economy.... … (UK's Economic Issues) Question 1a Unemployment in the uk economic Performance for the Past Five Years The state of unemployment in any given country has a number of impacts in a country's economy.... Economists have argued that this is a favourable situation as some countries which have had a large surplus like Japan have remained stagnant in growth but yet UK has been growing since the 1980s when the deficit began (EconomicOutlook, 2010: 60-76)....
5 Pages (1250 words) Essay

Effect of Oil Price on Kuwait Stock Market Index

This research paper “Effect of oil price on Kuwait Stock Market Index” is an attempt to assess the possibility of effects of the oil prices on the stock market index and it intends to establish all the links between the two values.... In any country, the fact of presence or absence of oil will always have an effect on the lives of the people because there are different values that people cannot overlook in the establishing of an economy of the country....
8 Pages (2000 words) Dissertation

RESEARCH Methods - Spain

Spain is considered for this case because it is a net importing country hence can help determining the resultant effect of oil price shock.... From this, the resultant model is used to explore the significance of oil price changes on GDP, Inflation and Trend Growth.... However, it is worth noting that the consequences can be welcomed differently between those oil importing regions and oil exporting… In which case, increase in oil price would have positive influence on the exporting countries while posing a negative consequence on the importing countries....
6 Pages (1500 words) Essay
sponsored ads
We use cookies to create the best experience for you. Keep on browsing if you are OK with that, or find out how to manage cookies.
Contact Us