StudentShare
Contact Us
Sign In / Sign Up for FREE
Search
Go to advanced search...
Free

The Strength of the Relationship Between Two Variables - Essay Example

Cite this document
Summary
The focus of this paper is on the coefficient for the CHARLES dummy. Unless Charles River is extremely polluted, potential buyers are likely to perceive the house near the river more favorably than one that does not bound the river. Preference for river-side houses will cause readiness to pay a price premium…
Download full paper File format: .doc, available for editing
GRAB THE BEST PAPER95.9% of users find it useful
The Strength of the Relationship Between Two Variables
Read Text Preview

Extract of sample "The Strength of the Relationship Between Two Variables"

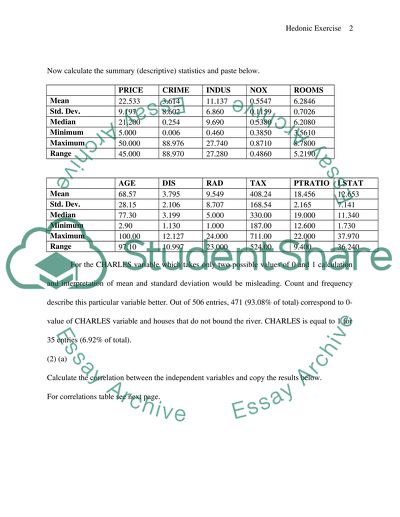
Resource Environmental Economics Exercise Please enter and email address here: Answer the following questions Before you run the regression, what are your expectations regarding the signs of the coefficients for the following variables Also explain briefly why. (a) Expected sign of the coefficient for the CHARLES dummy variable is positive. Unless Charles River is extremely polluted, potential buyers are likely to perceive the house near the river more favourably than one that does not bound the river. Preference for river-side houses will cause readiness to pay price premium. Therefore, houses that bound the river should be, on average, priced higher than those that do not and the CHARLES variable coefficient should be positive. (b) I expect pupil-teacher ratio to have little influence on the housing prices. The PTRATIO coefficient would probably have the negative sign as low pupil-teacher ratio may be perceived as an indicator of better education in a particular town. Nevertheless, the opposite situation is also possible. (c) NOX variable reflects the pollution level in the area. The 'dirtier' in terms of pollution a town is, the less would the demand for housing in it be. Therefore, I expect nitric oxides concentration variable to be negatively correlated with price of houses and the corresponding coefficient to have negative sign. Now calculate the summary (descriptive) statistics and paste below. PRICE CRIME INDUS NOX ROOMS Mean 22.533 3.614 11.137 0.5547 6.2846 Std. Dev. 9.197 8.602 6.860 0.1159 0.7026 Median 21.200 0.254 9.690 0.5380 6.2080 Minimum 5.000 0.006 0.460 0.3850 3.5610 Maximum 50.000 88.976 27.740 0.8710 8.7800 Range 45.000 88.970 27.280 0.4860 5.2190 AGE DIS RAD TAX PTRATIO LSTAT Mean 68.57 3.795 9.549 408.24 18.456 12.653 Std. Dev. 28.15 2.106 8.707 168.54 2.165 7.141 Median 77.30 3.199 5.000 330.00 19.000 11.340 Minimum 2.90 1.130 1.000 187.00 12.600 1.730 Maximum 100.00 12.127 24.000 711.00 22.000 37.970 Range 97.10 10.997 23.000 524.00 9.400 36.240 For the CHARLES variable which takes only two possible values of 0 and 1 calculation and interpretation of mean and standard deviation would be misleading. Count and frequency describe this particular variable better. Out of 506 entries, 471 (93.08% of total) correspond to 0-value of CHARLES variable and houses that do not bound the river. CHARLES is equal to 1 for 35 entries (6.92% of total). (2) (a) Calculate the correlation between the independent variables and copy the results below. For correlations table see next page. Correlations Table: CRIME INDUS CHARLES NOX ROOMS AGE DIS RAD TAX PTRATIO INDUS 0.407 1.000 CHARLES -0.056 0.063 1.000 NOX 0.421 0.764 0.091 1.000 ROOMS -0.219 -0.392 0.091 -0.302 1.000 AGE 0.353 0.645 0.087 0.731 -0.240 1.000 DIS -0.380 -0.708 -0.099 -0.769 0.205 -0.748 1.000 RAD 0.626 0.595 -0.007 0.611 -0.210 0.456 -0.495 1.000 TAX 0.583 0.721 -0.036 0.668 -0.292 0.506 -0.534 0.910 1.000 PTRATIO 0.290 0.383 -0.122 0.189 -0.356 0.262 -0.232 0.465 0.461 1.000 LSTAT 0.456 0.604 -0.054 0.591 -0.614 0.602 -0.497 0.489 0.544 0.374 (b) Comment briefly on whether the calculated correlation of LSTAT with each of these variables makes logical sense or not, and why: CRIME, INDUS, CHARLES, NOX, ROOMS, and AGE. LSTAT variable demonstrates absence of correlation with CHARLES. Position of houses near a river and percentage of the lower status population in the area do not depend on each other. It is quite logical because the former is determined by the geographical factors while the latter is more of social nature. LSTAT is moderately correlated with PTRATIO, CRIME, RAD (positive correlation), and DIS (negative correlation). Based on the correlation coefficient it cannot be determined which variable influences which. For example, we can assume that high percentage of lower status of the population leads to increase in crime rates because of high poverty levels. However, it can also be argued that the relationship between variables goes in the opposite direction and higher status population tries to avoid housing in the areas with high crime rates. The regions with high percentage of low status population also tend to be more accessible to radial highways, located further from the main employment centres and have, on average, more pupils per one teacher. LSTAT demonstrates moderate to moderately strong correlation with TAX, AGE, NOX, INDUS (positive correlation), and ROOMS (negative correlation). The higher is the percentage of the low status population in the area, the higher are property taxes, higher ration of old buildings, less average number of rooms in the house, higher industrialization of the area and concentration of nitric oxides in the air. Two latter variables are intuitively perceived to be interdependent and the strong correlation between them (0.764) supports this hypothesis. (3) (a) Perform the regression and paste your results below. Summary Multiple R R-Square Adjusted R-Square Standard Error Of Estimate Durbin Watson 0.8533 0.7281 0.7221 4.848516072 1.0482 ANOVA Table Degrees of Freedom Sum of Squares Mean of Squares F-Ratio p-Value Explained 11 31103.29001 2827.571819 120.2807 < 0.0001 Unexplained 494 11613.0054 23.5081081 Coefficient Standard Error t-Value p-Value Lower Limit Upper Limit Constant 42.084 4.986 8.4404 < 0.0001 32.287 51.880 CRIME -0.112 0.033 -3.3633 0.0008 -0.177 -0.046 INDUS -0.009 0.062 -0.1440 0.8856 -0.132 0.114 CHARLES 2.885 0.879 3.2822 0.0011 1.158 4.612 NOX -19.237 3.889 -4.9462 < 0.0001 -26.878 -11.595 ROOMS 3.879 0.420 9.2471 < 0.0001 3.055 4.703 AGE -0.002 0.013 -0.1354 0.8924 -0.028 0.024 DIS -1.216 0.187 -6.5205 < 0.0001 -1.583 -0.850 RAD 0.265 0.067 3.9449 < 0.0001 0.133 0.397 TAX -0.010 0.004 -2.6211 0.0090 -0.017 -0.002 PTRATIO -1.077 0.127 -8.4794 < 0.0001 -1.326 -0.827 LSTAT -0.543 0.051 -10.6236 < 0.0001 -0.644 -0.443 Therefore, at 5% significance level the regression equation is as follows: PRICE = 42.084 - 0.112*CRIME + 2.885*CHARLES - 19.237*NOX + 3.879*ROOMS - 1.216*DIS + 0.265*RAD - 0.010*TAX - 1.077*PTRATIO - 0.543*LSTAT. (b) What is the R-squared for the model, and what does it imply R-squared is equal to 0.7281. It indicates that the used model explains 72.81% of the variation in housing prices. 27.19% of price variation is not determined by nitric oxides concentration, crime rate, property-tax rates, or any other independent variables used in the model. (4) (a) Comment on the coefficient signs, magnitude and statistical significance for the following variables: INDUS, CHARLES, NOX and LSTAT. INDUS coefficient is equal to -0.009 and, on average, additional 10% of non-retail business per town would decrease the price of the house by $90. However, the standard error is relatively very high and the range is from -0.132 up to 0.114. It means that while some houses cost less if proportion of non-retail business per acre of town is higher, for other the opposite is true. Extremely high p-value for INDUS variable (0.8856) indicates statistical insignificance of the variable for this model. Therefore, average price of the housing does not depend on proportion of non-retail business and INDUS variable is not included into the final regression equation. CHARLES coefficient equals to 2.885, lower and upper limits are correspondingly 1.158 and 4.612. If a house bounds the river, it adds additional $2,885 to its price. The variable is statistically significant (p-value of 0.0011). NOX is the most influential factor as demonstrated by its coefficient equal to -19.237. The variable is statistically significant (p-value Read More
Cite this document
  • APA
  • MLA
  • CHICAGO
(The Strength of the Relationship Between Two Variables Essay, n.d.)
The Strength of the Relationship Between Two Variables Essay. Retrieved from https://studentshare.org/environmental-studies/1503197-resource-environmental-economics
(The Strength of the Relationship Between Two Variables Essay)
The Strength of the Relationship Between Two Variables Essay. https://studentshare.org/environmental-studies/1503197-resource-environmental-economics.
“The Strength of the Relationship Between Two Variables Essay”, n.d. https://studentshare.org/environmental-studies/1503197-resource-environmental-economics.
  • Cited: 0 times

CHECK THESE SAMPLES OF The Strength of the Relationship Between Two Variables

Aspects of Job Satisfaction Depending on Benefits

the relationship between the two variables, in this case, is expressed through the linear regression equation, y = a + bx.... 001144390 Note: Benefits = X Analysis of Results and Conclusion The assignment conducted three separate linear regression analyses in order to establish a relationship between independent and dependent variables obtained through a survey.... 5 X displays positive relationship between independent and dependent variables....
3 Pages (750 words) Research Paper

Qualitative And Mixed Method Approaches By John W. Creswell

You can even think of most research as a blending of these two terms -- a comparison of our theories about how the world operates with our observations of its operation... The paper "Qualitative And Mixed Method Approaches By John W.... Creswell" describes the ability to operate a process, procedure, or service and collects data consistently and reliably....
24 Pages (6000 words) Essay

Statistical techniques for investment, finance or economic problems

The two largest mortgage finance companies, Fannie Mae and Freddie Mac, needed a bail-out by the Bush administration; not long after insurance giant American International Group (AIG) followed suit.... These countries were the largest contributors to reductions in global poverty in the last two decades, as confirmed by several academic studies....
30 Pages (7500 words) Essay

EPIDEMIOLOGY and BIOSTATISTICS

two tests A and B are available to diagnose a particular communicable disease that is usually fatal if not diagnosed and treated.... Thus even for the same number of cases, the mortality rate of the two hospitals is not comparable.... Although some patients may require long term treatment, approximately 80% can be cured at modest cost with appropriate intervention....
13 Pages (3250 words) Essay

The Influence of the Cost of a Cookie on Its Taste Perception

A scatterplot can be a helpful tool in determining The Strength of the Relationship Between Two Variables.... ldquo;Linear regression attempts to model the relationship between two variables by fitting a linear equation to observed data.... A valuable numerical measure of association between two variables is the correlation coefficient, which is a value between -1 and 1, indicating the strength of the association of the observed data for the two variables....
5 Pages (1250 words) Term Paper

Role of Statistics in Politics

Based on the issue of study, the variables or factors contributing to the issue are recognized.... The writer of the paper "Role of Statistics in Politics' suggests that despite the power of statistics to make clear information is evident, the high possibility of misusing the tool is prevalent in politics....
11 Pages (2750 words) Research Paper

Chinese-English Biliteracy Acquisition

The study sought to investigate the relationship between cross-language and writing systems in Biliteracy acquisition by students who were learning to read in two diverse writing systems- English and Chinese.... In the paper under analysis, the quantitative method allowed the researchers to influence the two variables in successful reading acquisition, phonographic awareness, and orthographic skills.... "Quantitative Research Critique: relationship between a Dependent Variable and an Independent Variable" paper critiques a quantitative study that employs an experimental approach....
13 Pages (3250 words) Coursework

Existing Relationships between the Response Variable: Sales and Four Independent Variables

The Pearson correlation coefficient is used to measure the strength of association and the values range from a negative one to a positive one (Nikolić, et al.... A coefficient of negative one implies that the correlation between the two variables is perfectly negatively linearly correlated while a coefficient of positive one implies that the correlation between the two variables is perfectly positively linearly correlated (Mahdavi, 2013).... On the other hand, a coefficient of zero means that there is no correlation between the two variables (Anscombe, 1973)....
6 Pages (1500 words) Assignment
sponsored ads
We use cookies to create the best experience for you. Keep on browsing if you are OK with that, or find out how to manage cookies.
Contact Us