StudentShare
Contact Us
Sign In / Sign Up for FREE
Search
Go to advanced search...
Free

Sample Size Calculation - Math Problem Example

Cite this document
Summary
This math problem "Sample Size Calculation" shows that sampling is an important issue when undertaking research, there are various methods of sampling that can be used and the sampling method must be specifies in any study, the reason for specifying the sampling method…
Download full paper File format: .doc, available for editing
GRAB THE BEST PAPER97.3% of users find it useful
Sample Size Calculation
Read Text Preview

Extract of sample "Sample Size Calculation"

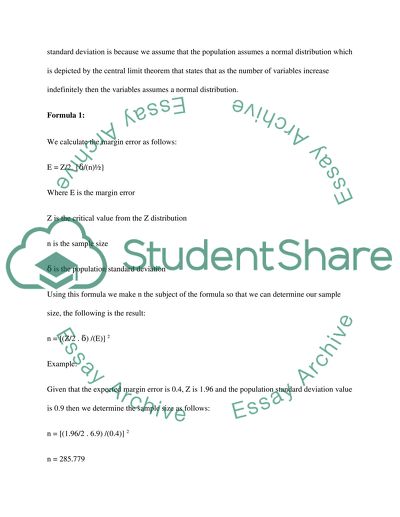
Sampling methods and sample size calculation: Introduction: Sampling is an important issue when undertaking research, there are various methods of sampling that can be used and the sampling method must be specifies in any study, the reason for specifying the sampling method is because this helps validate the sample used. Sampling methods include random sampling, cluster sampling and snowball sampling, the selection of the sampling method to be used will depend on the nature of study, and in this paper we consider how we can calculate the sample size given the population size. Sampling: Sampling is important in that we involve fewer respondents than using the entire population, the sample saves time and money and an appropriate sample will represent the population in that the results derived from the sample will explain the population with less error. A large sample will waste time and money while a small sample will give inaccurate results. Determining the sample size: In any given study if we were to determine the mean of the population and the mean of the sample there means are not the same, the difference between the two is termed as an error, therefore when determining the sample size we need to consider the expected error that will result to these differences. The other factor to consider is the margin of this error, this represents the maximum possible difference between the sample mean and the population mean. We consider also consider the standard deviation of the population, the reason why we consider the standard deviation is because we assume that the population assumes a normal distribution which is depicted by the central limit theorem that states that as the number of variables increase indefinitely then the variables assumes a normal distribution. Formula 1: We calculate the margin error as follows: E = Z/2. {'/(n)'} Where E is the margin error Z is the critical value from the Z distribution n is the sample size ' is the population standard deviation Using this formula we make n the subject of the formula so that we can determine our sample size, the following is the result: n = [(Z/2 . ') /(E)] 2 Example: Given that the expected margin error is 0.4, Z is 1.96 and the population standard deviation value is 0.9 then we determine the sample size as follows: n = [(1.96/2 . 6.9) /(0.4)] 2 n = 285.779 In this case therefore we will use a sample size n =286 derived from rounding off the figure into the nearest whole number. Cluster sampling: For a clustered study there is need to consider the sampling design when calculating the sample size, we consider the number of clusters after calculating the sample size, after determining the sample size as shown above we multiply the results by the number of clusters, the results of this are then multiplied by the an expected non response or error, example use 5%. After multiplying we then divide the results by the number of clusters to determine the number of n in each cluster. Example assumes that we have 10 clusters and we assume the level of error is 5% from our above results; the following will be the results: 285.779 X 10 = 2857.79 2857.79 X 1.05 = 3000.68 We will consider a 3,000 sample size and for each cluster we will have n = 300 Formula 2: The other formula that can be used is where we have the prevalence of the variable being studies, in this case for example we have a prevalence rate of 40% of a disease and we use the following formula: n = [Z2. x (1-x)]/ E2 Where Z is the confidence interval where if we choose 95% the area under the normal curve will be 1.96 E is the expected margin error and x is the expected prevalence of the variable being studied. Formula 3: Cochran (1963) formulated a formula that could be used in the calculation of the sample size in a study, the formula is as follows: n = (Z2 PQ)/ e2 Where n is the sample size, Z is the confidence interval, P is the estimated proportion of the attribute under study, q is derived from 1 - p and finally e is the precision level. He further stated that the above sample would further be reduced in the case where we have a finite population; in this case the formula used is as follows: n = n0/(1 + (no-1)/N Where N is the population size, n0 is the estimated value from the first equation Calculation of sample size for the study: First stage In this stage we use a 95% confidence interval and that the expected frequency of exposure is 20% and that e which is the level of precision is equal to 5%, therefore we use the formula n = (Z2 PQ)/ e2 To determine the sample size where Z = 1.96, P = 0.2, Q = 0.8 and e = 5% n = 245.8624 We further reduce the sample size using the formula n = n0/(1 + (no-1)/N Where n0 is 245.8624 and that N is 300000 This gives us n = 245.6619 due to the sampling design which has four controls we need to include this in the calculation of our sample size, for this reason we multiply the sample size by 4 and this gives us 982.6476, therefore we use a sample size n = 982. We use formula 3 to determine the sample size to be used for the study on HBV, HCV and HIV: The following table summarizes the sample size that will be considered in our study, however we will have to assume the value of the standard deviation for the population, however we will consider a confidence interval 95% which will yield Z = 1.96 as the area under the normal distribution curve. We use the formula n = (Z2 PQ)/ e2 to determine the sample size as follows: ' prevalence confidence level margin error ' ' ' ' ' ' ' p Z E z2 q pq Z2 .pq E2 [Z2 .pq]/E2 HBV 2 1.96 0.4 3.8416 98 196 752.9536 0.16 4705.96 HCV 1 1.96 0.2 3.8416 99 99 380.3184 0.04 9507.96 HIV 0.5 1.96 0.025 3.8416 99.5 49.75 191.1196 0.000625 305791.36 We further reduce the sample size using the formula n = n0/(1 + (no-1)/N no n = n0/(1 + (no-1)/N HBV 4705.96 4633.295 HCV 9507.96 9215.909 HIV 305791.4 151434.2 From the above table therefore we expect that under HBV we will have a sample size n = 4633, HCV sample size to be n = 9216 and HIV sample will be n=151434. The margin errors for the three samples will be 0.04, 0.02 and 0.025 for HBV, HCV and HIV respectively. References: Alan Stuart (1998) Basic Ideas of Scientific Sampling, McGraw Hill publishers, New York Cochran W. (1977) Sampling Techniques 3rd Edition, Wiley publishers, New York Kish L (1996) Survey Sampling, Wiley publishers, New York Read More
Cite this document
  • APA
  • MLA
  • CHICAGO
(“Sample size calculation Math Problem Example | Topics and Well Written Essays - 2250 words”, n.d.)
Sample size calculation Math Problem Example | Topics and Well Written Essays - 2250 words. Retrieved from https://studentshare.org/education/1531490-sample-size-calculation
(Sample Size Calculation Math Problem Example | Topics and Well Written Essays - 2250 Words)
Sample Size Calculation Math Problem Example | Topics and Well Written Essays - 2250 Words. https://studentshare.org/education/1531490-sample-size-calculation.
“Sample Size Calculation Math Problem Example | Topics and Well Written Essays - 2250 Words”, n.d. https://studentshare.org/education/1531490-sample-size-calculation.
  • Cited: 0 times

CHECK THESE SAMPLES OF Sample Size Calculation

Relationship Between Service Advertising Strategies and Consumers Responses Within Hospitality Industry

Simple random sampling was utilized in the calculation of minimum required sample size of 138.... This dissertation describes one of it's chapters, that provides the analysis of data in the study, purpose and techniques available and discussion of the relationship between service advertising strategies and consumers responses within hospitality industry....
13 Pages (3250 words) Dissertation

Comparison of Qualitative and Quantitative Research Methods

The paper "Comparison of Qualitative and Quantitative Research Methods" describes two different methods used for research in psychology.... Both methods are significant, and although they are different, psychologists work with both methods in order to obtain a crucial understanding of human behavior....
5 Pages (1250 words) Essay

The Co-Occurrence of Autism Spectrum Disorder and Attention-Deficit Disorder Symptoms

Critique a Research Article Name of the Article: The co-occurrence of autism spectrum disorder and attention-deficit/hyperactivity disorder symptoms in parents of children with ASD or ASD with ADHD Name of the Authors: Daphne J.... van Steijn, Jennifer S.... Richards, Anoek M.... hellip; Oerlemans, Saskia W....
5 Pages (1250 words) Research Paper

Experimental Evidence and Evaluation

This study “Experimental Evidence and Evaluation” is a proposal for the application of a research grant.... All studies can be categorized as experimental, quasi-experimental/pre-experimental, or non-experimental in design.... The Internal Control Index questionnaire will measure the health locus of control....
12 Pages (3000 words) Assignment

Critique the study of the article

Sample Size Calculation is not supported by assumptions taken.... sample size determination should have been given formula used and various assumptions applied. ... Explanation of mere number of participants per variable does not make things scientifically presentable when a study has to test some hypothesis....
4 Pages (1000 words) Lab Report

The Problem Of Planning

The paper "The Problem Of Planning" discusses how the researcher may be able to obtain approximate results about the behavior of the distribution of an estimator as the sample size becomes large.... nbsp;The economic reason of the large sample size is that a small sized study may be a waste of resources for not having the capability to produce the useful results.... he sample size is the number of observations that constitute the sample and it is normally represented by an integer (positive number)....
4 Pages (1000 words) Essay

Qualitative Research Methods

Quite understandably, there has been a heated debate over the past many years regarding the superiority of quantitative research over qualitative research and vice versa.... These debates have gone to take extreme forms as Donald Campbell says, “All research ultimately has ... ... … In the same way, one staunch supporter or believer of quantitative research has gone on to say, “Theres no such thing as qualitative data....
4 Pages (1000 words) Essay

Samping and Data Collection

n carrying out the sampling, the population will be the… The size of the hand will be the total number of customers who have visited the store for a given month. ... How can Wal-of-Stuff adjust their price structure and merchandise selection to change the purchasing habits of customers, and influence him or her to spend more money at their store locations during the income tax season? ...
3 Pages (750 words) Coursework
sponsored ads
We use cookies to create the best experience for you. Keep on browsing if you are OK with that, or find out how to manage cookies.
Contact Us