StudentShare
Contact Us
Sign In / Sign Up for FREE
Search
Go to advanced search...
Free

Sweden's Inbound Tourism Compared to Its Competitors - Statistics Project Example

Cite this document
Summary
This statistics project "Sweden's Inbound Tourism Compared to Its Competitors" focuses on Sweden that draws a lot of financial and economic benefits through increase revenue and income. Every year, the Swedish government receives an influx of domestic and international tourists. …
Download full paper File format: .doc, available for editing
GRAB THE BEST PAPER95.3% of users find it useful
Swedens Inbound Tourism Compared to Its Competitors
Read Text Preview

Extract of sample "Sweden's Inbound Tourism Compared to Its Competitors"

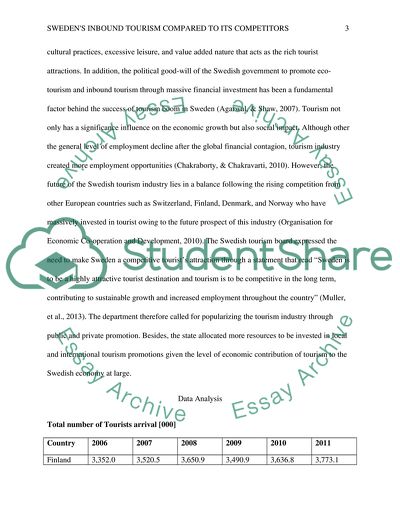
SWEDENS INBOUND TOURISM COMPARED TO ITS COMPETITORS Swedens Inbound Tourism Compared To Its Competitors Introduction Tourism plays a critical role in the economic development and growth. Like other countries, Sweden draws a lot of financial and economic benefits through increase revenue and income. Every year, the Swedish government receives an influx of domestic and international tourists. However, more than eighty percent of these tourists are local tourists who makes at least three weeks of travels exploring the beautiful sceneries and natural attraction sites that Sweden is endowed with. Despite the effects of the global financial crisis and economic recession that has impacted negatively on the European economies since 2007, tourism turnout for Sweden increased by at least 6%, hitting a record high of approximately SEK 251 billion (Peter, 2009). Over the same period, domestic leisure travel turnovers accounted for more than 45% of the total income realized from tourism, with exports consumption accounting for the SEK 93.6 billion (Peter, 2009). Other sectors of the Swedish economy recorded positive returns due to increase foreign consumption and export values. Global tourism growth rate is projected to reach a 4 percent mark by 2020 (Todd & OECD, 2008). The report on tourism further indicated that the industrial growth in the financial year 2011 was at 4% with all countries records posting positive figures with the exception of Ireland and the UK (OECD, 2012). Chinese tourist formed the majority of the incoming visitors accounting for about 30 percent of the total number of tourist in 2011 (OECD, 2012). Sweden is expected to enjoy a lion share of this growth rate because the country has some of the basic tourism resources including facilities, attractive destinations, rich cultural practices, excessive leisure, and value added nature that acts as the rich tourist attractions. In addition, the political good-will of the Swedish government to promote eco-tourism and inbound tourism through massive financial investment has been a fundamental factor behind the success of tourism boom in Sweden (Agarwal, & Shaw, 2007). Tourism not only has a significance influence on the economic growth but also social impact. Although other the general level of employment decline after the global financial contagion, tourism industry created more employment opportunities (Chakraborty, & Chakravarti, 2010). However, the future of the Swedish tourism industry lies in a balance following the rising competition from other European countries such as Switzerland, Finland, Denmark, and Norway who have massively invested in tourist owing to the future prospect of this industry (Organisation for Economic Co-operation and Development, 2010). The Swedish tourism board expressed the need to make Sweden a competitive tourist’s attraction through a statement that read “Sweden is to be a highly attractive tourist destination and tourism is to be competitive in the long term, contributing to sustainable growth and increased employment throughout the country” (Müller, et al., 2013). The department therefore called for popularizing the tourism industry through public and private promotion. Besides, the state allocated more resources to be invested in local and international tourism promotions given the level of economic contribution of tourism to the Swedish economy at large. Data Analysis Total number of Tourists arrival [000] Country 2006 2007 2008 2009 2010 2011 Finland 3,352.0 3,520.5 3,650.9 3,490.9 3,636.8 3,773.1 Denmark 6,293.0 6,319.9 5,990.1 5,741.4 5,861.5 6,002.9 Sweden 8,307.8 8,745.7 8,917.2 9,227.9 9,451.5 9,771.2 Norway 4,049.0 4,350.0 4,310.0 4,336.4 4,761.0 5,033.3 Over the six-year period, the statistics based on country of origin shows that Sweden had the largest number of tourism. The numbers of inbound tourists headed to Sweden from different countries increased 2006-2011 with 2011 posting the largest number of tourist with the number hitting a record high of 9,771, 200 up from 9,451,500 in the previous year. At the second position was Denmark that had unsteady increase in the numbers of arrivals. On the third was Norway that also showed an increasing trend in the number of tourist based on origin. Finland ranked last with its highest record coming in 2011 when it had slightly over three million tourists. Business versus Leisure Arrivals [000] Country Purpose 2006 2007 2008 2009 2010 2011 Finland Business 1,034.2 1,052.0 1,137.4 1,037.6 1,095.1 1,160.1 Leisure 2,317.8 2,468.5 2,513.5 2,453.2 2,541.7 2,613.0 Denmark Business 1,651.5 1,665.0 1,618.6 1,532.9 1,571.3 1,616.9 Leisure 4,625.1 4,638.0 4,352.7 4,188.9 4,267.4 4,359.2 Sweden Business 2,765.9 2,876.2 3,032.6 3,037.1 3,100.3 3,212.1 Leisure 5,541.8 5,869.4 5,884.6 6,190.8 6,351.2 6,559.1 Norway Business 974.5 1,082.5 1,105.3 1,085.4 1,185.4 1,280.4 Leisure 3,074.5 3,267.5 3,204.7 3,251.0 3,575.6 3,752.8 From the above statistics, it is evidence the main purpose of the tourists in all the four countries was leisure. Only a smaller number of the tourists travelled business purposes. Leisure travels were more than half of the total number of tourists in the four countries. When compared, Sweden had the highest number of tourists who visited the country for both business and leisure purposes. Business arrivals MICE 2006 -2011 [000] Country 2006 2007 2008 2009 2010 2011 Finland 1,034.2 1,052.0 1,137.4 1,037.6 1,095.1 1,160.1 Denmark 1,651.5 1,665.0 1,618.6 1,532.9 1,571.3 1,616.9 Sweden 2,765.9 2,876.2 3,032.6 3,037.1 3,100.3 3,212.1 Norway 974.5 1,082.5 1,105.3 1,085.4 1,185.4 1,280.4 These statistics show that norway had the least number of tourists by MICE or other over the six-year period. However, Sweden reported the highest number of business tourists by MICE which displayed an ascending pattern from 2006 to 2011. This was followed by the Denmark and Norway in that order. It is observed that all the countries showed an upward trend in the MICE for the six years. Arrivals by mode of transport from 2006-2011 (000) Country Transport 2006 2007 2008 2009 2010 2011 Finland Air 1769.8 1795.8 1842.1 1722.7 1825.4 1885.8 Land 489.0 566.4 611.6 572.9 619.9 637.2 Rail 164.7 196.2 221.0 209.0 226.7 263.1 Sea 928.5 972.0 976.3 986.2 967.7 986.9 Denmark Air 2907.3 2897.5 2829.6 2733.6 2837.4 2950.5 Land 2189.8 2211.6 1997.7 1910.2 1900.6 1895.2 Rail 900.3 909.2 878.4 828.2 842.7 861.7 Sea 279.2 284.8 265.6 249.8 258.0 268.7 Sweden Air 4970.7 5309.0 5462.1 5448.0 5685.0 5920.9 Land 1591.8 1675.5 1685.7 1810.6 1804.7 1844.7 Rail 635.6 672.9 674.5 747.5 746.5 754.0 Sea 1109.7 1088.3 1094.9 1221.9 1215.2 1251.5 Norway Air 1,710.3 1,860.8 1,814.5 1,822.9 2,033.1 2,162.1 Land 1,465.1 1,570.9 1,575.6 1,622.5 1,749.2 1,810.8 Rail 94.1 99.7 106.1 110.0 119.4 128.6 Sea 779.5 818.6 813.8 781.0 859.3 931.7 The mode of transport preferred by the tourists in these countries are air, land, rail, and sea. In all the four countries, it was noted that tourists preferred air as the mode of transport because of its efficiency and time saving. This was closely followed by land and sea. However, it was revealed that only a very small fraction of the tourist used rail transport because of the incoveniency and unflexibility of rail transport. Total Income in Euros (millions) Country 2006 2007 2008 2009 2010 2011 Finland 1,912.8 2,092.3 2,204.5 2,086.9 2,163.3 2,250.5 Denmark 3,601.0 3,663.55 3,515.64 3,439.35 3,534.75 3,613.75 Sweden 8,531.36 9,517.70 10,498.7 11,884.9 11,192.2 11,856.3 Norway 3,824.81 4,125.11 4,265.14 3,981.88 3,988.75 4,017.16 By measuring the revenue capacity generation of the four countries from 2006-2011, sweden received more revenue each year than the rest of the countries. The income increased througout the six-year period except in 2010 when sweden posted a decline in the revenue generated from tourism. Finland received the least income from tourism over the six-year period. Income/Revenue by category [in Euro millions] Country Category 2006 2007 2008 2009 2010 2011 Finland Accommodation 373.6 413.7 440.4 382.4 384.7 406.3 Entertainment 31.4 35.5 37.7 38.0 37.2 39.7 Excursions 63.1 65.8 70.3 70.5 77.7 80.3 Food 502.0 563.2 593.1 577.8 599.4 620.7 Shopping 470.5 502.4 531.9 504.2 519.1 544.6 Travel Within Country 322.2 347.3 371.6 356.4 390.6 399.2 Others 150.0 164.4 159.5 157.6 154.6 159.7 Denmark Accommodation 512.081 578.591 605.777 541.533 537.027 540.769 Entertainment 250.830 247.061 229.559 235.809 248.496 251.608 Excursions 68.7764 69.5811 69.8091 72.2635 79.3181 68.9910 Food 1,103.47 1,096.91 1,037.36 1,036.67 1,072.06 1,130.75 Shopping 804.032 808.002 758.082 758.163 773.077 787.937 Travel within 760.041 763.152 721.481 701.591 720.462 734.692 Others 101.770 100.254 93.5884 93.3068 104.318 99.0337 Sweden Accommodation 787.519 867.495 913.644 887.001 941.309 1,037.06 Entertainment 380.372 505.149 547.111 452.791 515.233 575.691 Excursions 110.457 125.656 133.008 106.859 118.050 126.787 Food 2,209.30 2,546.44 2,677.61 2,635.91 2,601.33 2,676.97 Shopping 1,176.84 1,470.03 1,831.13 2,440.92 2,338.43 2,504.25 Travel within country 2,026.60 2,423.18 2,588.95 2,286.91 2,304.70 2,396.19 Others 1,840.30 1,579.74 1,807.30 3,074.49 2,373.12 2,539.15 Norway Accommodation 246.216 278.684 288.458 292.128 298.353 304.282 Entertainment 46.1673 50.5366 54.0590 48.7217 50.0123 51.3298 Excursions 495.444 490.699 489.556 460.543 457.169 463.783 Food 487.069 542.633 548.791 460.543 479.863 492.151 Shopping 31.0560 34.3230 35.2103 31.0560 30.8275 30.5989 Travel within 1,811.14 1,956.60 2,076.06 1,973.00 1,942.99 1,944.28 Others 707.728 771.655 773.013 715.888 729.548 730.744 Leisure arrivals per type 2006-2011 for all 4 countries [%] Country Leisure type 2006 2007 2008 2009 2010 2011 Finland Singles 17.9 17.9 18.0 17.8 17.8 17.9 Couples 27.7 27.8 27.7 27.8 27.8 28.0 Families 15.7 15.7 15.7 15.8 15.8 15.9 Groups 29.6 29.0 29.1 28.2 27.6 27.4 Others 9.1 9.5 9.8 10.5 10.9 10.9 Denmark Singles 7.8 7.5 7.6 7.9 8.0 8.3 Couples 26.1 25.1 25.6 25.7 25.8 25.9 Families 42.2 40.9 41.9 40.1 40.0 40.1 Groups 4.6 4.4 4.4 3.6 3.5 3.5 Others 19.3 22.1 20.4 22.6 22.7 22.3 Sweden Singles 4.8 4.4 4.3 4.2 4.1 4.2 Couples 15.8 14.7 14.5 13.5 13.2 13.0 Families 21.1 19.9 21.7 22.0 22.1 22.2 Groups 2.9 2.8 3.0 2.9 3.0 3.1 Others 55.4 58.2 56.5 57.3 57.6 57.6 Norway Singles 6.5 6.0 6.1 5.7 5.7 5.6 Couples 16.7 18.4 19.0 18.9 19.0 19.0 Families 12.4 14.4 16.8 17.2 17.5 17.7 Groups 26.0 27.6 35.2 35.1 35.0 34.9 Others 33.6 38.4 22.8 23.1 23.0 22.8 As tabulated above, leisure tourists are categorized into five; singles, couples, families, groups, and others. For the case of Finland, over the six years, groups formed the highest proportion of leaisure tourists while couples occupied the second position. This two groups accounted for more than half of the tourists. For Denmark, families and couples are the majority of the leisure tourists which accounted for more than 60% of the total number of leisure tourists. On the other hand, singles and group leisure tourist had the least percentage. In Sweden, more than half of the leisure tourists belonged to other classes. Couples accounted for less than 10% while families on leisure tour in Sweden were almost a quarter of the total number of leisure tourists. Groups accounted for the least proportion with a percentage value of less than five. In norway, singles tourists on leisure tour were the minority with a proportion of less than ten percent of the total values while families and other groups on leisure tour were the majority over the six year perios. In conlusion, from the above statistics, it is observed that Sweden was the most successful country all the aspects of tourism. The country had the highest number of tourists between 2006 to 2011. The revenue realized from tourism sectors was the highest compared its competitors. This was attributed to successful marketing and promotion strategies of the government and the availability of a number of tourist attraction sistes and features. References Agarwal, S., & Shaw, G. (2007). Managing coastal tourism resorts: A global perspective. Clevedon [England: Channel View Publications. Chakraborty, A., & Chakravarti, B. K. (2009). Global tourism. New Delhi: A.P.H. Pub. Corp. Müller, D. K., Lundmark, L., & Lemelin, R. H. (2013). New issues in polar tourism: Communities, environments, politics. Dordrecht: Springer Science + Business Media Organisation for Economic Co-operation and Development. (2010). Measuring the Role of Tourism in OECD Economies: The OECD Manual on Tourism Satellite Accounts and Employment. Paris: OECD Publishing Organisation for Economic Co-operation and Development. (2010). OECD tourism trends and policies 2010. Paris: OECD. Peter, Terpstra. (2009). Tourism in Sweden: Effects of tourism on the economy and employment, volumes, behaviour and supply & demand. Swedish Agency for Economic and Regional Growth. Todd, G., & Organisation for Economic Co-operation and Development. (2008). Tourism in Oecd countries 2008: Trends and policies. Paris: OECD. Voase, R. N. (2001). Tourism in Western Europe: A collection of case histories. New York: CABI Publishing. Read More
Cite this document
  • APA
  • MLA
  • CHICAGO
(Sweden's Inbound Tourism Compared to Its Competitors Statistics Project Example | Topics and Well Written Essays - 1750 words, n.d.)
Sweden's Inbound Tourism Compared to Its Competitors Statistics Project Example | Topics and Well Written Essays - 1750 words. https://studentshare.org/tourism/1797397-swedens-inbound-tourism-compared-to-its-competitors
(Sweden'S Inbound Tourism Compared to Its Competitors Statistics Project Example | Topics and Well Written Essays - 1750 Words)
Sweden'S Inbound Tourism Compared to Its Competitors Statistics Project Example | Topics and Well Written Essays - 1750 Words. https://studentshare.org/tourism/1797397-swedens-inbound-tourism-compared-to-its-competitors.
“Sweden'S Inbound Tourism Compared to Its Competitors Statistics Project Example | Topics and Well Written Essays - 1750 Words”. https://studentshare.org/tourism/1797397-swedens-inbound-tourism-compared-to-its-competitors.
  • Cited: 0 times

CHECK THESE SAMPLES OF Sweden's Inbound Tourism Compared to Its Competitors

Importance of Cultural Heritage to Sweden

7 Pages (1750 words) Essay

Does the Universal Practice Model of HRM Exist

Companies have to monitor the social performance of its expatriate managers to ensure that as managers become familiar with the cultural aspects of the country.... Since its inception in 1950s IKEA has had to deal with the problem of maintaining its unique 'Swedishness' as a competitive advantage and at the same time having to adopt this to the different national cultures in which it has been working.... its biggest single markets are Germany, Sweden, and France....
7 Pages (1750 words) Term Paper

Qatar Airways Marketing Strategy

he inventor of Nation Branding in its modern form is Singapore's, Lee Kuan Yew.... It is worth mentioning that after almost a decade also, this particular study on Qatar Airways' nation and tourism branding will add up to the body of knowledge in marketing for the airline industry.... Developing economies also use Nation Branding to create more favorable conditions for foreign direct investment, tourism, trade and diplomatic relations with other countries....
11 Pages (2750 words) Case Study

Economic Policy and Vocational Training in the UK

The essay "Economic Policy and Vocational Training in the UK" focuses on the critical analysis of vocational education in the United Kingdom as compared to other European nations.... It discovers the reasons for the current level of investment in the education of 16-year-old students....
14 Pages (3500 words) Essay

The Use of Social Media by Hospitality and Tourism Organizations

The case study "The Use of Social Media by Hospitality and tourism Organizations" states that Social Media is the new marketing platform that is effectively used by different organizations that make them heard in the world of the internet.... Effective use of social media networks can help the destination marketing organizations and other hospitality and tourism organizations in attracting the maximum number of potential travelers.... It is important to understand that how the hospitality and tourism industry is using this social medium to create an impact in the minds of their customers....
12 Pages (3000 words) Case Study

Tourism in the UK

There are country house hotels, world class hotels, holiday caravan parks, bars, catering Tourism in the UK Introduction In order to grow the value of inbound tourism, it is important to conduct research on he trend of inbound tourism in the UK.... There is the ‘GREAT' campaign which was launched to promote domestic and inbound tourism.... inbound tourism Updated May 2014: Trends.... The UK however can still market its tourism industry to get more customers....
1 Pages (250 words) Essay

Tourism is whorism

tourism and sex trade are definitely two different phenomena, but there are tourist resorts all across the globe that show some positive correlation between the two.... One does not need to go very deep into the past to find proofs of correlation between sex trade and tourism, Fifa… World Cup 2014 in Brazil raised a rift of humanitarian outbreak against the influx of human subjects into the host country to facilitate the foreigners, and to entertain them....
1 Pages (250 words) Essay

History of the British American Tobacco Company

hellip; It also did pave its way through the controversies, which surrounded the smoking culture, reaching the goal of ultimate success.... The policy helped the company to spread its network all across the continents of Africa, continental Europe, Asia, and Latin America....
18 Pages (4500 words) Research Paper
sponsored ads
We use cookies to create the best experience for you. Keep on browsing if you are OK with that, or find out how to manage cookies.
Contact Us