StudentShare
Contact Us
Sign In / Sign Up for FREE
Search
Go to advanced search...

Changes in Unemployment Statistics in UK over Time - Assignment Example

Cite this document
Summary
Changes in Unemployment Statistics in UK over Time Report March 12, 2012 s Institution’s Name Introduction To attain an eloquent grasp of social and business issues, the use of statistical techniques is requisite. For instance, in the analysis of data on unemployment rates, numerous statistical tools, each giving unique and intimate understanding of the data, are of primary importance…
Download full paper File format: .doc, available for editing
GRAB THE BEST PAPER96.7% of users find it useful
Changes in Unemployment Statistics in UK over Time
Read Text Preview

Extract of sample "Changes in Unemployment Statistics in UK over Time"

Download file to see previous pages

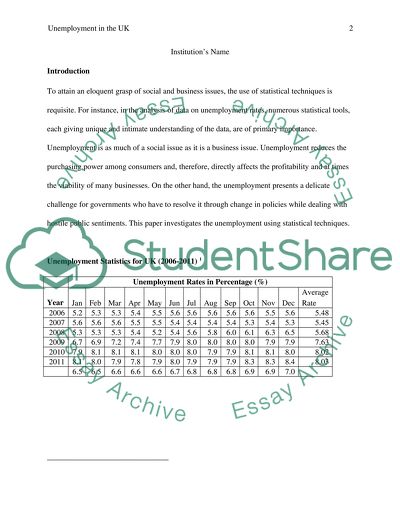
This paper investigates the unemployment using statistical techniques. Unemployment Statistics for UK (2006-2011) 1 Unemployment Rates in Percentage (%) Year Jan Feb Mar Apr May Jun Jul Aug Sep Oct Nov Dec Average Rate 2006 5.2 5.3 5.3 5.4 5.5 5.6 5.6 5.6 5.6 5.6 5.5 5.6 5.48 2007 5.6 5.6 5.6 5.5 5.5 5.4 5.4 5.4 5.4 5.3 5.4 5.3 5.45 2008 5.3 5.3 5.3 5.4 5.2 5.4 5.6 5.8 6.0 6.1 6.3 6.5 5.68 2009 6.7 6.9 7.2 7.4 7.7 7.9 8.0 8.0 8.0 8.0 7.9 7.9 7.63 2010 7.9 8.1 8.1 8.1 8.0 8.0 8.0 7.9 7.9 8.1 8.1 8.0 8.02 2011 8.1 8.0 7.9 7.8 7.9 8.0 7.9 7.9 7.9 8.3 8.3 8.4 8.03 6.5 6.5 6.6 6.6 6.6 6.7 6.8 6.8 6.8 6.9 6.9 7.0 _______________________________ 1Trading Economics, “United Kingdom Unemployment Rate”.

Trading Economics. 2012. < http://www.tradingeconomics.com/united-kingdom/unemployment-rate >, accessed 12, March 2012. Analysis the Unemployment Data Scatterplots Histograms Pie charts Cumulative frequency curves Measures of Averages Yearly Averages Measure Value Description Mean 6.72% The average of the rates of unemployment over the six year period Mode 8.03% The highest value on the histogram Median 6.66% The middle value, calculated by averaging the third and fourth value Monthly Averages Measure Value Description Mean 6.

72% The average of the rates of unemployment over the six year period Mode 6.95% The highest value on the histogram Median 6.75% Middle value, calculated by averaging the sixth and seventh month What the data shows The social and economic impact of unemployment is insidious 2. Unemployment is usually attributable to the inability by able and willing persons to find sources of income regardless of active search for work. The unemployment data trend according to the histogram and the scatterplot indicate that the rate of unemployment has been rising over the six-year period ranging from 2006-2011.

The greatest upsurge in the percentage unemployment rate was for the 2008 to 2009, where the rate rose from 5.68% to 7.63%, a 34.3% increase in unemployment rate 3. The unusual rise is attributable to the 2008 economic meltdown, which forced many companies into liquidation and loss-making streaks for many corporations 4. The unfavorable economic conditions not only curbed growth in employment opportunities but also made corporate leaders lay off many workers to alleviate cost overruns. For the entire period the data concerns, particular salient features reveal themselves as to the general trend in the data.

For instance, the earliest period, January 2006 has the lowest unemployment rate at 5.2% while the latest period, December 2011 has the highest unemployment rate at 8.4% 5. Unemployment rate in the UK is, therefore, on an increasing trend. ______________________________ 2 Bell, David and Blanchflower, David. What Should be Done about Rising Unemployment in the UK? Dartmouth College. 2009. p.2 3 Trading Economics, “United Kingdom Unemployment Rate”. Trading Economics. 2012. < http://www.tradingeconomics.

com/united-kingdom/unemployment-rate >, accessed 12, March 2012. 4 ibid 5 ibid As the table and the graphs indicate, the unemployment rate, on average, increases on a yearly base. Despite the increase due to the 2008 economic crisis, the rate is yet to fall, although it remains considerably steady

...Download file to see next pages Read More
Cite this document
  • APA
  • MLA
  • CHICAGO
(“Changes in Unemployment Statistics in UK over Time Assignment”, n.d.)
Changes in Unemployment Statistics in UK over Time Assignment. Retrieved from https://studentshare.org/statistics/1444756-statistical-research-project-investigate-a-social
(Changes in Unemployment Statistics in UK over Time Assignment)
Changes in Unemployment Statistics in UK over Time Assignment. https://studentshare.org/statistics/1444756-statistical-research-project-investigate-a-social.
“Changes in Unemployment Statistics in UK over Time Assignment”, n.d. https://studentshare.org/statistics/1444756-statistical-research-project-investigate-a-social.
  • Cited: 0 times

CHECK THESE SAMPLES OF Changes in Unemployment Statistics in UK over Time

Statistics1

The error means that the statistic for the sample will be different from the parameter for the populationBasic characteristics of experimentAn experiment is a scientific research method in which the researcher controls one or more variables and measures the changes in other variables.... Inferential statistics are… In simplest of terms, sample is a subset of population which is the whole set for which we want to make inferences about.... Generally the sample is used to make Descriptive and inferential statistics Descriptive statistics are the set of statistical measures that can be used to summarize the data....
2 Pages (500 words) Statistics Project

Cyclical, Frictional and Structural Unemployment

The paper “Cyclical, Frictional and Structural Unemployment” examines types of unemployment, different approaches to compiling US unemployment statistics, monetary and fiscal measures to reduce unemployment, principles for developing government policies to combat unemployment etc.... Compared to previous months, major industries such as mining, manufacturing, wholesale trade, transportation and warehousing, information, financial activities, state government, and local government recorded dismal changes in employment....
6 Pages (1500 words) Statistics Project

SE-5004L Statistics and Econometrics, Semester Two, 2013/4

The data is a time series data spanning from 2001 to 2012.... The dependent variable represents the per capita on cheese while the independent variable is the unemployment rate from uk. Per capita data for food has… n used instead of total value as the dependent variable since it is regarded as the average data on food, a measure of the food consumption of the population of a nation and it is particularly in comparison to other nations. Looking at the table below (regression output table), we observe that the coefficient for the unemployment rate is 6....
6 Pages (1500 words) Statistics Project

Leading Causes of Homelessness by State in the USA

The study will review statistics from the last 34 years leading cause of homelessness by state in the USA starting 1980 to 2013.... We will investigate the factors; homelessness, unemployment, saving, inflation, Below_povert, state… We applied the regression analysis that used the dependent variable as unemployment, the independent variables as taxation, inflation, and savings.... A regression analysis between the independent variables unemployment, From the results, we obtain that the leading cause of homelessness is unemployment among the people, unemployment, saving, inflation, Below_povert, state population, homelessness population, AA- housing, home percent....
15 Pages (3750 words) Statistics Project

Statistics on Violent Crime Among UK Youth (2013)

This essay "Statistics on Violent Crime Among uk Youth (2013)" focuses on the violent crime that refers to actual or threatened aggression which accompanies the commission of an offence.... statistics indicate that members of the group engaged in more than a million cases of violent crimes in 2013 alone.... Government statistics show that almost 20% of all juvenile youth first apprehended in 2004 continued their delinquent behaviour through 2013, with 16-year-olds being most likely to engage in repeat offences (Flatley, 2013)....
8 Pages (2000 words) Statistics Project

Informal Social Control and High Drug Use in Louisville and Lexington

This research paper investigates the roles that informal social control plays in the rising high drug usage areas of Louisville and Lexington, Kentucky.... Using data from the Interuniversity Consortium for Political and Social Research (ICPSR), the relationship between informal… Social control denotes a form of regulation exercised by the authorities on groups of people or individuals to make them conform to a specific set of rules or social-legal parameters....
16 Pages (4000 words) Statistics Project

Current Financial and Economic Situation in the UK

This paper “Current Financial and Economic Situation in the uk” summarizes that after the Thatcher crisis the uk economy has recovered, although it is experiencing a budget deficit and high inflation.... nbsp;… Under the Thatcher legacy, some claimed that one of the factors contributing to 1992 uk economic recession was the global recession whereas others pointed the blame on Lawson for failing to recognize the full implications of implementing financial de-regulation on most of its state-owned enterprises within the industrial and service sectors....
15 Pages (3750 words) Statistics Project

The Potential Challenges in the UK Automobile Branch

There was a sudden surge in trade activities around the world accompanied by changes in the tastes and preferences of people.... However, what missed the perceptions of the global leaders at that time was that “liberalization” was just another version of experiencing a “multiplicative effect”.... The paper «The Potential Challenges in the uk Automobile Branch” ascertains the British trade unions' high activity due to the unreasonable demands of the multinational working community....
9 Pages (2250 words) Statistics Project
sponsored ads
We use cookies to create the best experience for you. Keep on browsing if you are OK with that, or find out how to manage cookies.
Contact Us