StudentShare
Contact Us
Sign In / Sign Up for FREE
Search
Go to advanced search...
Free

Investment Analysis of Mohawk Industry, Inc and Carpetright - Coursework Example

Cite this document
Summary
The paper "Investment Analysis of Mohawk Industry, Inc and Carpetright" states that Mohawk and Carpetright are both in the carpet business and both companies are being traded.  They use stock market trading as a source of finance for their operations and acquisitions of properties…
Download full paper File format: .doc, available for editing
GRAB THE BEST PAPER93.8% of users find it useful
Investment Analysis of Mohawk Industry, Inc and Carpetright
Read Text Preview

Extract of sample "Investment Analysis of Mohawk Industry, Inc and Carpetright"

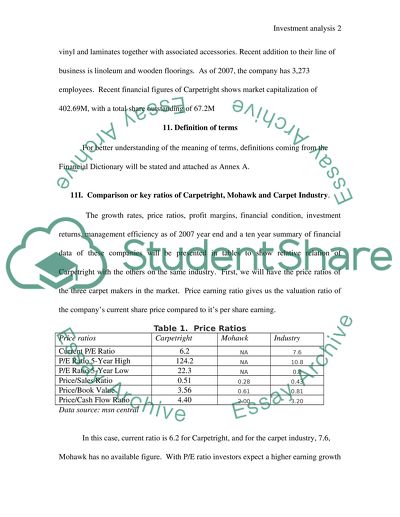
Investment analysis of Mohawk Industry, Inc. and Carpetright Profitability ratios are analytical tools used by analysts in determining profitability of a company in relation to sales and investments. In determining investments to a company, key ratios should be examined and compared with the industry to know how the company you want to invest in stands as against its competition. The key ratios of Mohawk Industry, Inc. and Carpetright will be compared with each other to arrive at an appropriate investor’s decision. Key ratios of both companies will be analyzed on the basis of the following: growth rates, price ratios, profit margins, financial condition, investment returns, management efficiency and a ten year summary of financial data. 1. Background of Carpetright and Mohawk Industry Mohawk Industry. Mohawk Industries is a company in the US producing floor covering products for commercial and residential applications lines distributed in the United States and Europe. It has a total of 36,200 employees and a recent reported market capitalization of. 1.77billion US dollars. It has total outstanding share of 68.4million US dollars. Carpetright Carpetright specializes on floor covering and has more than 300 stores all over Great Britain. It is based in United Kingdom, sells and retails a range of carpets, rugs, vinyl and laminates together with associated accessories. Recent addition to their line of business is linoleum and wooden floorings. As of 2007, the company has 3,273 employees. Recent financial figures of Carpetright shows market capitalization of 402.69M, with a total share outstanding of 67.2M 11. Definition of terms For better understanding of the meaning of terms, definitions coming from the Financial Dictionary will be stated and attached as Annex A. 11I. Comparison or key ratios of Carpetright, Mohawk and Carpet Industry. The growth rates, price ratios, profit margins, financial condition, investment returns, management efficiency as of 2007 year end and a ten year summary of financial data of these companies will be presented in tables to show relative relation of Carpetright with the others on the same industry. First, we will have the price ratios of the three carpet makers in the market. Price earning ratio gives us the valuation ratio of the company’s current share price compared to it’s per share earning. Table 1. Price Ratios Price ratios Carpetright Mohawk Industry Current P/E Ratio 6.2 NA 7.6 P/E Ratio 5-Year High 124.2 NA 10.8 P/E Ratio 5-Year Low 22.3 NA 0.8 Price/Sales Ratio 0.51 0.28 0.43 Price/Book Value 3.56 0.61 0.81 Price/Cash Flow Ratio 4.40 2.00 3.20 Data source: msn central In this case, current ratio is 6.2 for Carpetright, and for the carpet industry, 7.6, Mohawk has no available figure. With P/E ratio investors expect a higher earning growth compared to a company with lower P/E. Comparing the P/E ratio of Carpetright to the industry on a 5 year level, Carpetright maintains a high P/E. Investors should not base investment decisions on P/E measures alone, as Investopedia says the earnings is based on an accounting measure of earnings that is susceptible to manipulation. Being so, rightful decision should be based on other factors as well. a.. Growth rates. This is a measure used by stock researchers in recommending to investors whether to purchase, hold or sell its shares. Growth rate measures the percentage increase in the value of markets, companies or operations of the companies. (Dictionary of Financial terms). A quarterly revenue growth is an increase in company’s sales as compared to previous quarter’s revenue performance. Revenue growth helps the investors and analysts draw a picture of how much the company’s sales are increasing over time. Table 2 discusses the growth rate of the carpet market. Table 2. Growth rates Growth Rates % Carpetright Mohawk Industry Sales (Qtr vs. year ago qtr) 9.30 -9.00 -4.60 Net Income (YTD vs. YTD) NA NA 1.60 Net Income (Qtr vs. year ago qtr) -16.50 -1,316.50 -764.20 Sales (5-Year Annual Avg.) 3.63 10.93 8.50 Net Income (5-Year Annual Avg.) 2.60 19.96 9.49 Dividends (5-Year Annual Avg.) 7.04 NA 1.83 Data source: Table 2 shows sales growth rate of Carpetright as compared with its own quarter year performance a year ago showed 9.30%, while that of Mohawk and the industry shows negative growth rate. All three had negative growth income for the same quarter. Growth in sales on a five year average for Carpeetright is rather small as compared to Mohawk and the industry, as well as growth in net income. However, dividends have a strong growth compared with the industry. Mohawk has no figure. Revenue growth helps the investors and analysts see how much the company’s sales are increasing over time. b Profit Margin . An investor always takes a look at profitability of the company and one ratio that provides that information is the profit margin. It is the ratio that shows the earnings available to stockholders and the relationship of gross profits to net sales in a business. Table 3. shows company performance along with profit margins Table 3. Profit Margin. Profit Margins % Carpetright Mohawk Industry Gross Margin 62.0 26.2 26.2 Pre-Tax Margin 11.4 -13.9 -22.4 Net Profit Margin 8.2 -13.3 -8.0 5 Yr Gross Margins (5-Year Avg.) 60.4 27.7 26.3 5Yr Pretax Margin (5-Year Avg.) 14.0 8.9 -7.6 5 Yr Net Profit Margins (5-Year Avg.) 9.8 6.8 -9.2 Source: moneycentral The profitability of the operations of Carpetright could be seen in comparison with Mohawk and the Industry. Carpetright shows a high ratio of earnings in relation to sales. After deduction of all necessary taxes and expenses, a net profit margin of 8.2 remains for the business to carry out its obligations to stockholders. It remains good indicator for Carpetright, as competitors showed negative net profit margin. Carpetright shows 9.8 5yr. net profit margin which means it has an average income of $0.098 for each dollar of sales. c. Financial condition. This is a picture of the health of the company as reflected in its financial statement. It shows the company’s assets, liabilities and equity positions. A company may be described as having a strong financial position with a “fairly valued and relatively liquid assets combined with a small amount of debt compared to owner’s equity”. (Investopedia) Table 4 shows the financial condition of the three carpet makers. Table 4. Financial condition Financial Condition Carpetright Mohawk Industry Debt/Equity Ratio 0.89 0.62 1.75 Current Ratio 0.5 2.3 2.4 Quick Ratio 0.3 1.1 1.3 Interest Coverage 46.8 -6.4 -3.1 Leverage Ratio 4.5 2.1 3.6 Book Value/Share 1.66 48.91 33.31 Source: moneycentral Financial ratios are used to know the company’s method of financing and how does it pay its financial obligations Debt/equity ratio of Carpetright is higher than Mohawk but lower than the industry average. This means that the assets provided by creditors is more than the assets provided by shareholders. Current ratio is the company’s ability to pay its short term debt obligations. From the table, Carpetright shows a low current ratio as compared with competitors.. A high current ratio shows the company is more liquid and is able to pay short term debts.. “A relatively high current ratio compared with those of other firms in the same business indicates high liquidity and generally conservative management, although it may tend to result in reduced profitability”. (Investopedia) Sometimes called acid-test ratio, it is a test to measure the capability of the company to pay short-term obligations and at the same time determines liquidity of the company A high quick ratio shows conservative management.. Mohawk and Industry show high quick ratio while that of Carpetright shows lower quick ratio. In terms of interest coverage, it could be assumed that Carpetright keeps a timely interest payment as their interest coverage shows 46.8 ratio, the highest in comparison to the competitors. A high coverage ratio indicates enhanced ability to make timely interests payments. (Investopedia) The ratio of the stockholders equity as against the average number of common shares, or Book value per share of Carpetright is lowest among the competitors However, it should be not considered as an indicator of economic worth, since according to Investopedia, it is not a market valuation, but rather an accounting valuation. d. Investment return. . Your return on investment (ROI) is the profit you make on the sale of a security or other asset divided by the amount of your investment, expressed as an annual percentage rate. For example, if you invested $10,000 and the investment was worth $12,500 after two years, your annual return on investment would be 25%. “Return on investment includes all the income you earn on the investment as well as any profit that results from selling the investment. It can be negative as well as positive if the sale price plus any income is lower than the purchase price” (Investopedia, 2008). Table 5. Investment Return Investment Returns % Company Mohawk Industry Return On Equity 60.2 -25.1 -16.8 Return On Assets 14.2 -12.3 -8.9 Return On Capital 28.3 -14.6 -8.7 Return On Equity (5-Year Avg.) 85.8 14.8 19.2 Return On Assets (5-Year Avg.) 18.8 7.2 4.2 Source: moneycentral The first question of any investor is the return on their investment and they are focused on the profitability of their investment. ROE is used by investors in finding out how the company uses its money. The ratio on the return on equity shows how much profit a company gets with the shareholders investment. Investopedia says, this ratio is a good measure in comparing the profitability of the company with that of the others in the same It can be seen from the table that Carpetright provides a high ROE as against its competitors. Mohawk and the carpet industry both showed negative rates on ROE, ROA and ROC. On a 5 year average, Carpetright still beats the competitors with an ROA of 18.8 and ROC of 43.9, while Mohawk and Industry has maintained the low level for both categories. e Management efficiency. Typically, it is a ratio expressed in percentage of expenses over revenue, and the lower percentage means expenses are low and earnings are big. Table 6 presents management efficiency Table 6. Management Efficiency Management Efficiency Carpetright Mohawk Industry Income/Employee 12,056 -26,285 -16,779 Revenue/Employee 221,004 197,471 221,524 Receivable Turnover 17.6 7.4 7.1 Inventory Turnover 5.2 4.2 4.4 Asset Turnover 1.7 0.9 1.0 Source Moneycentral Mohawk has more employees than Carpetright as seen in earlier discussions. However in terms of ratio of expenses to employees in relation to income and revenue, Carpetright provides higher income and revenue to its employees. The ratio of receivables turn over refers to the collections of accounts from customers. If the ratio of turn-over of receivables is too low, there is something wrong with the policy and internal problem in the company, either the terms of payment is too long, or the company is very lenient in their collections. Carpetright shows a high average of 17.65 of receivable turn over while Mohawk and the industry both indicates low receivable turn over f. Comparison of 10 year average data A trend analysis of 10 year summary data can be used to compare company’s own performance over time. This would show the average performance of the company under different profit variables. Table 7. Mohawk 10 year data Avg P/E Price/ Sales Price/ Book Net Profit Margin (%) 12/07 8.50 0.67 1.08 9.3 12/06 11.40 0.64 1.37 5.8 12/05 14.80 0.89 1.92 5.8 12/04 14.30 1.05 2.28 6.3 12/03 13.30 0.95 2.04 6.2 12/02 13.00 0.82 1.91 6.3 12/01 10.50 0.85 3.05 5.5 12/00 7.70 0.44 1.90 4.8 12/99 10.90 0.50 2.16 4.9 12/98 16.00 0.90 4.17 4.0 Source: moneycentral The most important ratio to look at in this table is the net profit margin because this is the amount left for stockholders after the company has deducted all the necessary expenses. From 1998 to 2007, net profit margin increase is in a slow upward growth. It is steady in a single digit proportion, as compared with Carpetright which in a double digit net profit margin from year 2000 to 2008, with exception of year 1999. Other variables cannot be compared as Carpetright has no available data. Table 8. Carpetright 10 year ave. data   Avg P/E Price/ Sales Price/ Book Net Profit Margin (%) 05/08 NA NA NA 12.3 04/07 51.80 4.89 34.18 14.6 04/06 NA NA NA 14.7 04/05 38.40 3.77 41.66 16.0 05/04 NA NA NA 16.3 05/03 NA NA NA 13.0 04/02 NA NA NA 15.1 04/01 NA NA NA 14.7 04/00 NA NA NA 12.6 05/99 NA NA NA 9.6 Source: msncentral g. Comparison of 10 yr. average data on investment returns. Since investors are mostly interested on details of return on equity as it will show profitability and show how much an investor earns, data on this will be compared. Tables 9 and 10 show 10 yr. average of Carpetright and Mohawk. Let us take figure 2007 for both companies. Debt/equity ratio for Carpetright 0.41 ROE 68.1 Debt/equity ratio for Mohawk 0.49 ROE 15.1 Take note that debt/equity ratio falls almost in the same range, but the gap of return on investment has a big difference. The rest of the year’s data follows almost the same pattern with Carpetright having a higher ROE Table 9. Carpetright 10 year average data on investment returns   Book Value/ Share Debt/ Equity Return on Equity (%) Return on Assets (%) Interest Coverage 05/08 $1.66 0.89 57.6 12.8 21.7 04/07 $1.51 0.41 68.1 17.3 26.5 04/06 $1.24 0.69 78.8 17.8 26.5 04/05 $.91 1.05 120.0 22.5 29.8 05/04 $.87 1.07 121.4 23.0 35.7 05/03 $1.11 0.87 69.6 16.3 23.9 04/02 $1.09 0.11 66.9 22.7 57.3 04/01 $.91 0.17 69.5 21.7 87.3 04/00 $.71 0.10 72.0 22.5 75.8 05/99 $.69 0.07 49.8 17.1 36.0 Source: money central Table 10. Mohawk Industry 10 yr. average data on investment returns.   Book Value/ Share Debt/ Equity Return on Equity (%) Return on Assets (%) Interest Coverage 12/07 $68.86 0.49 15.0 8.1 4.9 12/06 $54.83 0.77 12.3 5.6 4.8 12/05 $45.31 1.11 12.7 4.8 10.1 12/04 $39.94 0.35 13.9 8.4 12.0 12/03 $34.54 0.44 13.5 7.4 9.8 12/02 $29.88 0.41 14.3 7.9 7.6 12/01 $18.00 0.33 19.9 10.7 11.0 12/00 $14.42 0.78 21.6 9.1 8.2 12/99 $12.21 0.86 22.7 9.3 9.0 12/98 $10.09 0.62 Source: moneycentral IV. Non-financial information a. Mohawk management, in the shareholder’s information provided by its Chairman reported significant acquisitions and expansion plans for development on its future plans. b. Mohawk, in the management report said it had addressed the problem of costs and had closed a ceramic manufacturing plant. Mohawk had tried to be competitive in its positioning in the market and acquired four pre-finishing plants in the amount of $147 million as part of their long term development plan. c. Plans for the future are the continued acquisition and internal growth to broaden marketing capabilities, its distribution and marketing distribution. d. Acquisition of properties and expansion may be one of the reasons for slow growth of Mohawk. It is a billion dollar company well positioned in the market, but its growth has been limited. e. However, as an investor, it might be best to make a deeper study on investing in Mohawk under its present financial condition. V. Discussions of changes 1. The latest estimates made by analysts and brokers expert on market trading do not show a positive prospect for Mohawk Industry. It has continued to slide down, as could be seen on the earning estimates in Table 11. Table 11. Earning Estimate of Mohawk   Earnings Estimates Qtr(12/08) Qtr(3/09) FY(12/08) FY(12/09) Average Estimate 0.26 0.45 3.61 2.80 Number of Analysts 6 4 5 6 High Estimate 0.30 0.75 3.65 3.60 Low Estimate 0.24 0.10 3.60 2.50 Year Ago EPS 1.57 0.95 6.35 3.61 Growth Rate -83.55% -52.37% -43.12% -22.48% Source: moneycentral Earning estimates made by analysts and brokers for Mohawk Industries remain to be negative up the year 2009. It shows a negative growth rate of -83.55% in last quarter of 2008 and slowly going down to -22.48% to 2009. 2. Recent developments and studies made by market analysts support a HOLD decision on the trading of stock market for Mohawk Industry, Inc. Earnings estimate for Mohawk show also a negative estimate for year 2008 up to 2009. Shown below is the analysis report for Mohawk Industry done by market analysts. Mohawk Industries Inc: Analyst Ratings Source: moneycentral Financial data in U.S. dollars Analyst Recommendations data provided by Zacks Investment Research Analyst Ratings Recommendations Current 1 Month Ago 2 Months Ago 3 Months Ago Strong Buy 3 3 3 3 Moderate Buy 1 1 1 1 Hold 3 3 3 3 Moderate Sell 0 0 0 0 Strong Sell 1 1 1 0 Mean Rec. 2.34 2.34 2.34 1.96 Mean Recommendation Conversion Table 1.0 = Strong Buy 1.1 thru 2.0 = Moderate Buy 2.1 thru 3.0 = Hold 3.1 thru 4.0 = Moderate Sell 4.1 thru 5.0 = Strong Sell Source: msn money central .   Earnings Estimates Qtr(12/08) Qtr(3/09) FY(12/08) FY(12/09) Average Estimate 0.26 0.45 3.61 2.80 Number of Analysts 6 4 5 6 High Estimate 0.30 0.75 3.65 3.60 Low Estimate 0.24 0.10 3.60 2.50 Year Ago EPS 1.57 0.95 6.35 3.61 Growth Rate -83.55% -52.37% -43.12% -22.48% Source: msn money central 3. In this aspect, it would be necessary to take a thorough analysis in the financial statements of the Mohawk Industry to find out the internal problems that may have caused the weakness in the financial estimates which is not covered in this study. 4. On the part of Carpetright, data on analysts report and growth estimates is shown below. Ten analysts have made estimated earnings for Carpetright of 39.23 for 2008 and slowly going down to 36.47 in 2009, and a brokers’ mean recommendation of 2.7 on the trend summary of the company. Earnings Est. 2008 2009 Avg. Estimate 39.23 36.47 Low Estimate 32.93 26.78 High Estimate 53.04 52.51 No. of Analysts 10 10 Source: Yahoo Finance Recommendation trends for Carpetright prepared by market analysts. Number of brokers recommending as Current Month 1 Month Ago 2 Months Ago 3 Months Ago Buy 0 0 0 1 Overweight 0 0 0 0 Neutral 3 2 2 4 Underweight 0 1 1 1 Negative 6 5 1 1 Mean Recommendation 2.7 2.7 2.7 2.1 * (Buy) 1 - 3 (Negative) Data provided by FactSet JCF. Source: Yahoo finance Estimated Revenues for Carpetright prepared by market analysts. Revenue Est. 2008 2009 Revenue Avg. Estimate 486.29 M 494.39 M Cash Flow per share 35.81 42.54 Ebitda Avg. Estimate 57.72 M 57.18 M Ebit Avg. Estimate 40.87 M 39.94 M Pre-Tax Profit Avg. Estimate 36.93 M 33.72 M Net Profit Avg. Estimate 27.97 M 26.14 M Dividend per share 34.26 33.26 Net Assets per share 116.71 123.52 Net Debt Avg. Estimate 59.11 M 44.65 M * negative net debt signifies net cash position Source: Yahoo Finance Conclusion As an investor, knowing the financial position of the company for investment is of utmost importance. No one would invest in a losing business proposition and looking at the financial statements and analysis unlocks the key of information one needs to know. Mohawk and Carpetright are both in the carpet business and both companies are being traded. They use the stock market trading as a source of finance for their operations and acquisitions of properties. An investor then should know how these companies are able to meet their obligations and pay their shareholders a return for their investment. In comparing Mohawk and Carpetright with each other and with the industry, an investor could very well gauge its management performance, and could be guided where to invest its money. The decision will depend of course on the investors, but having a guide will lead the investor to a wise decision. Annex A Definition of terms as given by Financial Dictionary * P/E ratio is derived by dividing the current stock price by the trailing annual earnings per share or expected annual earnings per share. * Market to book ratio. A ratio comparing the market price of a firms common stock with the stocks book value per share. Essentially, the market to book ratio relates what the investors believe a firm is worth to what the firms accountants say it is worth according to accepted accounting principles. A low ratio indicates investors belief that the firms assets have been overvalued on its financial statements Price-to-cash-flow ratio (P/CF ratio). A stock valuation measure calculated by dividing a firms cash flow per share into the current stock price. Financial analysts often prefer to value stocks using cash flow rather than earnings because the latter is more easily manipulated. Gross margin. Gross margin is the percentage by which profits exceed production costs. To find gross margin you divide sales minus production costs by sales. Net profit margin Net income divided by sales; the amount of each sales dollar left over after all expenses have been paid. Aftertax net income divided by net sales, a measure of managements ability to carry a dollar of sales down to the bottom line for the stockholders. In other words, net profit margin refers to that which is left for the owners from a dollar of sales after all expenses and taxes have been paid. .. Debt/equity ratio. Indicator of financial leverage. Compares assets provided by creditors to assets provided by shareholders. Determined by dividing long-term debt by common stockholder equity. Current ratio. Indicator of short-term debt-paying ability. Determined by dividing current assets by current liabilities. The higher the ratio, the more liquid the company Current ratio is a measure of a firms ability to meet its short-term obligations. The current ratio is calculated by dividing current assets by current liabilities. Both variables are shown on the balance sheet. A relatively high current ratio compared with those of other firms in the same business indicates high liquidity and generally conservative management, although it may tend to result in reduced profitability. Quick ratio. A relatively severe test of a companys liquidity and its ability to meet short-term obligations. The quick ratio is calculated by dividing all current assets with the exception of inventory by current liabilities. Inventory is excluded on the basis that it is the least liquid current asset. A relatively high quick ratio indicates conservative management and the ability to satisfy short-term obligations. Also called acid-test ratio. Interest coverage. A measure of a firms ability to meet required interest obligations. A high coverage ratio indicates enhanced ability to make timely interest payments. Interest coverage is calculated by dividing the firms operating income by its required interest payments. Book value per share. The ratio of stockholder equity to the average number of common shares. Book value per share should not be thought of as an indicator of economic worth, since it reflects accounting valuation (and not necessarily market valuation). Return on equity (ROE) A measure of the net income that a firm is able to earn as a percent of stockholders investment. Many analysts consider ROE the single most important financial ratio applying to stockholders and the best measure of performance by a firms management. Return on equity is calculated by dividing net income after taxes by owners equity. Book value per share. Common stockholders equity determined on a per-share basis. Book value per share is calculated by subtracting liabilities and the par value of any outstanding preferred stock from assets and dividing the remainder by the number of outstanding shares of stock. Return on equity (ROE). Indicator of profitability. Determined by dividing net income for the past 12 months by common stockholder equity (adjusted for stock splits). Result is shown as a percentage. Investors use ROE as a measure of how a company is using its money. ROE may be decomposed into return on assets (ROA) multiplied by financial leverage (total assets/total equity). Return on capital, also known as return on invested capital, is a non-GAAP financial measure that quantifies how well a company generates cash flow relative to the capital it has invested in its business. It is defined as Net operating profit less adjusted taxes divided by invested capital and is usually expressed as a percentage. In this calculation, capital invested includes all monetary capital invested: shareholders equity plus financial debt. When the return on capital is greater than the cost of capital (usually measured as the weighted average cost of capital), the company is creating value; when it is less than the cost of capital, and value is destroyed. Receivables turnover ratio. Total operating revenues divided by average receivables. Used to measure how effectively a firm is managing its accounts receivable Return on assets (ROA) Indicator of profitability. Determined by dividing net income for the past 12 months by total average assets. Result is shown as a percentage. ROA can be decomposed into return on sales (net income/sales) multiplied by asset utilization (sales/assets). Annex 2 Financial Statement of Carpetright Top of Form View: AnnualInterim Bottom of Form In Millions of British Pounds (except for per share items) 2008 2008-05-03 Period Length 27 Weeks 2008 2007-10-27 Period Length 26 Weeks 2007 2007-04-28 Period Length 26 Weeks 2007 2006-10-28 Period Length 26 Weeks 2006 2006-04-29 Period Length 26 Weeks Revenue 270.5 251.0 247.5 228.4 235.9 Other Revenue, Total -- -- -- -- -- Total Revenue 270.5 251.0 247.5 228.4 235.9 Cost of Revenue, Total 102.0 96.4 96.0 89.1 92.2 Gross Profit 168.5 154.6 151.5 139.3 143.7 Selling/General/Admin. Expenses, Total 141.6 130.8 121.1 113.2 108.9 Research & Development -- -- -- -- -- Depreciation/Amortization -- -- -- -- -- Interest Expense, Net - Operating -- -- -- -- -- Interest/Investment Income - Operating -- -- -- -- -- Interest Expense(Income) - Net Operating -- -- -- -- -- Unusual Expense (Income) -- -- -- -- -- Other Operating Expenses, Total (5.1) (5.0) (9.8) (2.5) (5.6) Total Operating Expense 238.5 222.2 207.3 199.8 195.5 Operating Income 32.0 28.8 40.2 28.6 40.4 Interest Expense, Net Non-Operating (1.9) (0.9) (1.6) (1.0) (1.5) Interest/Invest Income - Non-Operating 1.3 0.2 0.7 0.1 0.4 Interest Income(Exp), Net Non-Operating (0.6) (0.7) (0.9) (0.9) (1.1) Gain (Loss) on Sale of Assets -- -- -- -- -- Other, Net -- -- -- -- -- Net Income Before Taxes 31.4 28.1 39.3 27.7 39.3 Provision for Income Taxes 8.6 8.1 12.0 8.7 12.3 Net Income After Taxes 22.8 20.0 27.3 19.0 26.9 Minority Interest -- -- -- -- 0.0 Equity In Affiliates -- -- -- -- -- U.S. GAAP Adjustment -- -- -- -- -- Net Income Before Extra. Items 22.8 20.0 27.3 19.0 26.9 Accounting Change -- -- -- -- -- Discontinued Operations -- -- -- -- -- Extraordinary Item -- -- -- -- -- Tax on Extraordinary Items -- -- -- -- -- Net Income 22.8 20.0 27.3 19.0 26.9 Preferred Dividends -- -- -- -- -- General Partners Distributions -- -- -- -- -- Miscellaneous Earnings Adjustment -- -- -- -- -- Pro Forma Adjustment -- -- -- -- -- Interest Adjustment - Primary EPS -- -- -- -- -- Income Available to Com Excl ExtraOrd 22.8 20.0 27.3 19.0 26.9 Income Available to Com Incl ExtraOrd 22.8 20.0 27.3 19.0 26.9 Basic Weighted Average Shares 67.50 67.90 67.90 67.90 67.80 Basic EPS Excluding Extraordinary Items 0.338 0.295 0.402 0.280 0.397 Basic EPS Including Extraordinary Items 0.338 0.295 0.402 0.280 0.397 Dilution Adjustment 0.1 -- 0.0 0.0 0.0 Diluted Weighted Average Shares 67.80 68.00 68.10 67.90 67.96 Diluted EPS Excluding ExtraOrd Items 0.338 0.294 0.401 0.280 0.396 Diluted EPS Including ExtraOrd Items 0.338 0.294 0.401 0.280 0.396 DPS - Common Stock Primary Issue 0.320 0.200 0.300 0.200 0.300 Gross Dividends - Common Stock 20.2 14.8 20.4 13.5 20.4 Total Special Items -- -- -- -- -- Normalized Income Before Taxes 31.4 28.1 39.3 27.7 39.3 Effect of Special Items on Income Taxes -- -- -- -- -- Inc Tax Ex Impact of Sp Items 8.6 8.1 12.0 8.7 12.3 Normalized Income After Taxes 22.8 20.0 27.3 19.0 26.9 Normalized Inc. Avail to Com. 22.8 20.0 27.3 19.0 26.9 Basic Normalized EPS 0.338 0.295 0.402 0.280 0.397 Diluted Normalized EPS 0.338 0.294 0.401 0.280 0.396 Source: Reuters References 1. Investopedia. (2008). Financial Dictionary 20 Nov. 2008. 2. msn Money. (2008.) “Mohawk Industries Inc: Earnings Estimates. “ 21 Nov. 2008. http://www.moneyceneteral.msn.com/investor/invsub/analyst/recomnd.asp?s ymbol-+mhk. 3. msn money (2008.) “Carpetright PLC: Key Ratios “. 20 Nov. 2008. 4. Mohawk Industries Inc. (04 Nov. 2008). 20 Nov. 2008. http://phx.corporate- ir.net/phoenix.zhtml?c=95954&p=irol-estimates> 5, Reuters. “Financial Statement: Carpetright”. 20 Nov. 2008. . 6. Yahoo Finance. (2008). “Carpetright. Analysts Opinion.” 20 Nov. 2008. Read More
Tags
Cite this document
  • APA
  • MLA
  • CHICAGO
(“Carpetright plc financial comparison Coursework”, n.d.)
Carpetright plc financial comparison Coursework. Retrieved from https://studentshare.org/miscellaneous/1549804-carpetright-plc-financial-comparison
(Carpetright Plc Financial Comparison Coursework)
Carpetright Plc Financial Comparison Coursework. https://studentshare.org/miscellaneous/1549804-carpetright-plc-financial-comparison.
“Carpetright Plc Financial Comparison Coursework”, n.d. https://studentshare.org/miscellaneous/1549804-carpetright-plc-financial-comparison.
  • Cited: 0 times

CHECK THESE SAMPLES OF Investment Analysis of Mohawk Industry, Inc and Carpetright

Niagara-Mohawk - Art Deco

The essay "Niagara-mohawk - Art Deco" explores the Syracuse's building.... According to the paper the Niagara-mohawk - Art Deco is a classic building found in Syracuse, New York, which was listed on the register of historic places in 20101.... The building was completed in 1932 and became the headquarter of the then large electric utility company, Niagara mohawk power utility company.... First, the building is constructed with a central tower that protrudes upwards compared to the rest of the building, giving it the characteristic mohawk structure....
3 Pages (750 words) Essay

Mohawk Industries

n the year 1956, Mohasco Industries was formed by a merger of Mohawk Mills inc and Alexander smith Inc.... The company Alexander Smith inc, another New York based company was also having a steady background for its growth starting from the year 1845.... Being one of the oldest companies in the carpet and flooring industry, Mohawk has a tradition of more than 120 years to back its fame and standing in the world market.... Mohawk Industries 0 Introduction: Being one of the oldest companies in the carpet and flooring industry, Mohawk has a tradition of more than 120 years to back its fame and standing in the world market....
2 Pages (500 words) Case Study

The Appeal of Mohawk Carpet for Investors

The author states that the appeal of mohawk Carpet for investors seems broader than the expanse of wall to wall carpeting in the 1950s.... Branching out into the non-traditional floor covering types has positioned Mohawk into a bid for the lead market share in the industry.... Instead of a careful and slow-growing conservative company I see a concern poised to take advantage of lower transport costs than since the beginning of the Iraq war; along with integrated tile manufacture, to challenge Shaw's leading market share in this industry....
1 Pages (250 words) Assignment

Investment in Libyan Oil Industry

analysis of an overall picture of the Libyan economy and its oil industry particularly after the new regime has come into effect2.... analysis of some of the major oil companies in Libya.... o study the oil industry of the country and the levels of competition amongst the oil companies.... During the course of the study efforts would be made to evaluate how these investors respond to the introduction of economic reforms and how the oil industry in general is being affected by these reforms....
4 Pages (1000 words) Case Study

Strategic Audit of Mohawk Industries

This paper "Strategic Audit of mohawk Industries" analyzes the strategic position of mohawk Industries given the market condition and situation of the company and her competition.... s the leading firm in the market, Mohawk's financial data (shown in Annexes 1 to 9 of this work) is indicative of the industry's long-term profitability.... mohawk Industries is analyzed for strengths, weaknesses, opportunities, and strengths.... Based on the analysis that followed or attempted to follow the Wheelen and Hunger methodology, mohawk Industries current strategy statement of five imperatives is hereby being proposed to be ten instead of only five....
22 Pages (5500 words) Assignment

Innovative Organisations: Mohawk Industry

The paper 'Innovative Organisations: mohawk industry' seeks to evaluate an unavoidable concept to those who wish to develop and maintain a competitive edge.... ontextual factors such as the industry to which the organization belongs, location, knowledge and awareness, and public and governmental policies, also affect innovation.... The type of industry, whether supplier dominated, scale intensive or specialized suppliers, determine the level of innovation (Pavitt 1984; Becheikh, Landry and Amara 2006)....
10 Pages (2500 words) Case Study

Global Running and Risk Management Analysis of Carpetright Plc

The paper "Global Running and Risk Management analysis of Carpetright Plc" is a brilliant example of a case study on finance and accounting.... The paper "Global Running and Risk Management analysis of Carpetright Plc" is a brilliant example of a case study on finance and accounting.... carpetright is a multinational retailer floor Coverings Company.... carpetright is a multinational retailer floor Coverings Company situated in the UK which is exposed to the above risks....
12 Pages (3000 words) Case Study

Investment Analysis: Australian Foundation Investment Company

The paper "investment analysis: Australian Foundation Investment Company" is a great example of a literature review on macro and microeconomics.... The paper "investment analysis: Australian Foundation Investment Company" is a great example of a literature review on macro and microeconomics.... ResMed inc is a manufacturing company that develops and markets medical products.... The Australian Foundation investment Company is a limited company that deals with a managing a variety of Australian stocks....
7 Pages (1750 words) Literature review
sponsored ads
We use cookies to create the best experience for you. Keep on browsing if you are OK with that, or find out how to manage cookies.
Contact Us