StudentShare
Contact Us
Sign In / Sign Up for FREE
Search
Go to advanced search...
Free

Marginal Product, Marginal Cost and Average Total Cost - Term Paper Example

Cite this document
Summary
This paper discusses the production curves and cost curves of a firm, in the first part we determine the marginal product curve and the total product curve to help us determine the three stages of production of a firm. The second part discusses the cost curves which include the total cost curve…
Download full paper File format: .doc, available for editing
GRAB THE BEST PAPER95.3% of users find it useful
Marginal Product, Marginal Cost and Average Total Cost
Read Text Preview

Extract of sample "Marginal Product, Marginal Cost and Average Total Cost"

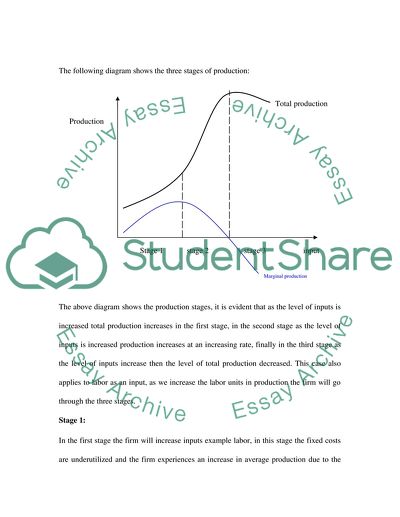
Marginal product, marginal cost and average total cost: Introduction: This paper discusses the production curves and cost curves of a firm, in the first part we determine the marginal product curve and the total product curve to help us determine the three stages of production of a firm. The second part discusses the cost curves which include the total cost curve, the marginal cost curve and the average total cost curve. In this section we also determine the profit maximization point using the marginal cost curve and marginal revenue curve. Marginal production: Firm inputs include labor, capital, raw materials and other resources such as land, a firm has its variable and fixed costs, variable costs include labor, raw materials and other costs that depend on the units consumed. Fixed costs include rent, insurance costs and other costs that the firm will pay regardless of whether the firm produces or does not produce a single unit. A firm will price its goods depending on the cost of production, however the cost of production reduces as the firm increases its level of production because the fixed costs are distributed to more units and therefore costs reduces, as a result of these reduction in cost the firm has three stages of production namely the first stage, the second stage and the third stage. The following diagram shows the three stages of production: The above diagram shows the production stages, it is evident that as the level of inputs is increased total production increases in the first stage, in the second stage as the level of inputs is increased production increases at an increasing rate, finally in the third stage as the level of inputs increase then the level of total production decreased. This case also applies to labor as an input, as we increase the labor units in production the firm will go through the three stages. Stage 1: In the first stage the firm will increase inputs example labor, in this stage the fixed costs are underutilized and the firm experiences an increase in average production due to the increase in inputs. Output at this level increase at an increasing rate and therefore firms will tend to increase their inputs in order to increase output. Second stage: In the second stage marginal product decline and total production increase at a decreasing rate, at this stage there is an increase in utilization of the fixed costs or inputs. The fixed costs are shared in more and more products and therefore this stage is more efficient than stage one, therefore the most optimal point of production is at this stage. The point where stage two bounders stage three is the most optimal point of production where marginal production is zero. Stage three: In this stage marginal product is declining and at this stage there is over utilization of both variable and fixed inputs, at this stage still the maximum possible production level is reached and the firm may experience a decline in total production, the decline can be explained by the fact that if a firm utilise4s labor in production and there are too many workers employed then production will decline because workers are overcrowded. However in the long run a firm may expand and increase its fixed costs to increase production. Therefore from the above discussion it is evident that as a firm increases its inputs in the short run production increases, increasing inputs means in order to increase production means that the firm fixed inputs are shared by more inputs, as a result of this efficiency increases as production increase, in the first state marginal product increase at an increasing rate, in the second stage marginal product still increase but at a decreasing rate and finally in the third stage total production is constant and even declines. Example: We consider a firm that utilizes labor as a variable input and determine the three stages of production, we also calculate the total production and the marginal production level in order to determine the three stages, the table below summarizes a hypothetical firm variables: labor units total production marginal product average product 0 0 0 1 10 0 10 2 21 11 10.5 3 39 18 13 4 55 16 13.75 5 65 10 13 6 66 1 11 7 64 -2 9.142857143 8 62 -2 7.75 9 58 -4 6.444444444 In the above table we assume that the firm in the short run can employ 9 labor units, we also assume that the total product increase as the number of labor units increase, finally we calculate the marginal product by determining the additional units resulting to an increase in labor units, for example the marginal product for three labor units is given by (39 – 21)/ 1 = 18 The average product is also calculated by dividing total product by the labor units used, example in the case for 5 labor units the average product is calculated as follows: 65/5 = 13 We represent the information in a graph as follows: From the chart it is evident that total product increase at an increasing rate when we add up to 3 labor units and this is what is referred to as the first stage of production, the second stage is from the three units of labor to six units of labor and from that point we have the third stage of production. It is also evident that average product increase in the first stage, it declines in the second and third stage as depicted by the graph above. Marginal costs and average total cost: A firm incurs both variable and fixed costs, therefore the total cost of a firm is equal to variable cost plus the fixed costs, fixed costs are those costs that don not change when the firm increases or reduces production levels, and however variable costs will change when the firm increases or reduces production. Marginal costs is an economic concept that refers to the additional cost resulting from an increase in production, marginal cost curves are useful in that they are used in the determination of the most optimal point of production and also in determining the profit maximization point for a firm. The average total cost is also a concept in economics that refers to the average cost incurred in each production level, the average cost is determined by dividing the total cost by the total number of products produced at the point of interest, and we use the following data to determine the total cost, average total cost and marginal cost: units produced fixed cost variable cost total cost average total cost marginal cost 1 100 60 160 160 40 2 100 80 180 90 20 3 100 90 190 63.33333333 10 4 100 95 195 48.75 5 5 100 105 205 41 10 6 100 120 220 36.66666667 15 7 100 150 250 35.71428571 30 8 100 200 300 37.5 50 9 100 270 370 41.11111111 70 10 100 400 500 50 130 From the above table it is evident that average cost is determined by dividing the total cost by the total number of units produce, for example by producing 8 units the total cost is 300, therefore the average total cost is 300/8 = 37.5, for marginal cost at 8 units we determine the additional cost incurred and at eight units the marginal cost is determined by (300- 250)/ 1 = 50, the chart below summarizes the costs in this case: From the chart it is evident that marginal costs drops as production increases, however at 4 units the marginal cost attains its lowest value and starts to rise, the most optimal point of production will therefore be at 4 units when the marginal cost is at its lowest. For the average cost the trend is that as production increases the average costs decreases. Marginal cost curve and the marginal revenue curve will give us the profit maximization point, the profit, maximization pointy is the point where the two curves meet, for example if we assume that the products produced by our firm is sold at 60 dollars per unit we can determine the profit maximization point, we use the following data to determine the point of profit maximization. units produced total cost marginal cost revenue marginal revenue profit 1 160 40 60 60 -100 2 180 20 120 60 -60 3 190 10 180 60 -10 4 195 5 240 60 45 5 205 10 300 60 95 6 220 15 360 60 140 7 250 30 420 60 170 8 300 50 480 60 180 9 370 70 540 60 170 10 500 130 600 60 100 From the above table the profit level is determined by subtracting total cost from total revenue, the marginal revenue curve is also the price level which is 60, from the chart we can determine the profit maximization level which is the point where the marginal cost is equal to marginal revenue, we can also determine the profit maximization level by observing the maximum possible profit which is a profit level of 180 which will be realized by producing 8 units. The above data is summarized by the chart below: The chart includes the profit curve, the marginal cost curve and the marginal revenue curve, the two curves intersect at point 8.5 and at this point the profit level is at maximum. The profit curve depicts an increase in profits and it reaches a point and starts to drop. The marginal revenue curve is a straight line and the marginal cost curve declines and then increased as production increases. Therefore the profit maximization point can be easily be determine by the point where the marginal cost curve cuts the marginal revenue curve. Therefore when the firm is producing below 8 units it experiences an increase in profits when production is increased, however above 8 units the firm experiences a reduction in its profit levels, therefore the firm should produce at the optimum point where profits are at maximum. The profit maximization point can also be determined using the total cost and revenue method whereby the two curves are drawn using on the same chart and the profit maximization point determined. Conclusion: From the above discussion it is evident that a firm needs to determine its production curves in order to determine the most optimal point to produce, the firm may also derive its production curves ion order to determine the stage of production, the cost curves are also useful for a firm to determine the most optimal point to produce to maximize profits. References: Daniel Rubinfeld (2004) Microeconomics, Prentice Hall publishers, New Jersey Gregory Mankiw (2001) Principles of Microeconomics, Prentice Hall publishers, New Jersey Phillip Hardwick (2002) introduction to modern economics, McGraw Hill publishers, New York Rosser M (1998) Microeconomics: The Firm and the Market Economy, Blackwell publishers, Oxford Read More
Cite this document
  • APA
  • MLA
  • CHICAGO
(Marginal Product, Marginal Cost and Average Total Cost Term Paper - 1, n.d.)
Marginal Product, Marginal Cost and Average Total Cost Term Paper - 1. Retrieved from https://studentshare.org/macro-microeconomics/1718960-microeconomics
(Marginal Product, Marginal Cost and Average Total Cost Term Paper - 1)
Marginal Product, Marginal Cost and Average Total Cost Term Paper - 1. https://studentshare.org/macro-microeconomics/1718960-microeconomics.
“Marginal Product, Marginal Cost and Average Total Cost Term Paper - 1”, n.d. https://studentshare.org/macro-microeconomics/1718960-microeconomics.
  • Cited: 0 times

CHECK THESE SAMPLES OF Marginal Product, Marginal Cost and Average Total Cost

Financial Analysis of the Marstons Group

Financial Analysis of the Marston's Group Marston Group is a privately owned specialist firm operating in United Kingdom aiming to provide its services in the field of civil and high court enforcement.... It's an agency that provides an ethical and professional approach to clients seeking recovery solutions; from amicable recovery to enforcement....
8 Pages (2000 words) Essay

Average and Marginal Cost, and Average and Marginal Revenue

Therefore, Average and marginal cost and average and marginal revenue are calculated for each production level and tabulated in the paper.... Average and marginal cost, and average and marginal revenue in the scenario are not one, rather varies according to the production level (Mankiw, 1998).... There is no optimum value for marginal revenue and average revenue.... hellip; The analysis in the paper shows that the lowest average cost corresponds to the level at which the lowest marginal cost of production is reached by the production system....
5 Pages (1250 words) Assignment

Average Cost Curves

This is the total cost of producing the next unit.... A key component and indicator on the graph of the SRAC is the marginal cost (MC).... However, going beyond this point will cause the marginal cost to spike upward on a steeper slope than the average.... When the marginal cost line crosses the average, production is at its most efficient.... The point at which the marginal cost begins to rise and cross the SRAC is the point at which Acme must consider expanding their production capabilities....
4 Pages (1000 words) Case Study

Production and Cost Relationships

The above discussion looked at how average total cost, marginal cost, and marginal products behave in the long-run and short-run.... In order to understand the average total cost, it is best to have a comprehension of what comprises the total cost that a business organization faces.... Dividing the total cost with the number of quantities produced by the business organization will yield the average total cost (Brue and McConnell 2005).... In general, the company is faced with two different costs which make up its total cost namely fixed cost and variable cost (Brue and McConnell 2005)....
5 Pages (1250 words) Coursework

Analysis of the Steps Towards Cost Leadership

In this essay "Analysis of the Steps Towards Cost Leadership", economies of scale result when fixed costs are spread over more and more units of production, resulting in a lower total cost per unit.... Economies of scope seek to reduce per unit total cost by diversifying the products a firm makes and sells.... By increasing the number of product lines and extending the use of inputs (manpower and machinery) over the alternative products, the overall cost per unit of each product line is reduced because of the sharing of fixed costs among the product lines....
9 Pages (2250 words) Essay

Introduction to Accounting

Graphically, breakeven point is achieved when the total cost curve meets the total revenue costs.... This means that when the levels of production increase, increase in variable cost is registered.... On the other hand, a reduction in the levels of production leads to direct decrease in… Examples of variable costs include labor, cost of distribution, raw materials and use of energy in this whisky company.... On the other hand, the cost will not change even when sales made are very high....
4 Pages (1000 words) Essay

Reasons to Invest in a Wristwatch

These include expenses for labor, insurance of the building, advertisement cost and power for the production (Peterson & Fabozzi, 2006).... I have decided to use cost accounting especially the marginal costing to clearly illustrate the contribution each unit of the product can yield as opposed by the full costing method.... The cash balance for the product will be £3797362 and consequently the total sales are anticipated to be £52141029.... On aggregate, the total costs sum up to $252601....
4 Pages (1000 words) Essay

Costing Systems and Techniques in Engineering

It is essential for a company to have a cost accounting system to be capable to exercise control over the real costs incurred compared with estimated expenditure.... From this point of view of cost control, a costing system must not just be able to recognize any costs that are going out of control but must also provide a tool that can help in shaping the action that is necessary to put things accurately.... Contract costing is Parts' costing is uncomplicated and is simply a question of determining the cost of all of the physical parts and components used in a manufactured or engineered product....
8 Pages (2000 words) Assignment
sponsored ads
We use cookies to create the best experience for you. Keep on browsing if you are OK with that, or find out how to manage cookies.
Contact Us