StudentShare
Contact Us
Sign In / Sign Up for FREE
Search
Go to advanced search...
Free

Economics graphs - Statistics Project Example

Cite this document
Summary
You must include at least one diagram in your overall answer, but may use more if you wish. In economic terms, market equilibrium refers to the point where the quantity demanded and supplied are equal at a particular price level. It is the point where the demand curve intersects with supply curve…
Download full paper File format: .doc, available for editing
GRAB THE BEST PAPER95.2% of users find it useful
Economics graphs
Read Text Preview

Extract of sample "Economics graphs"

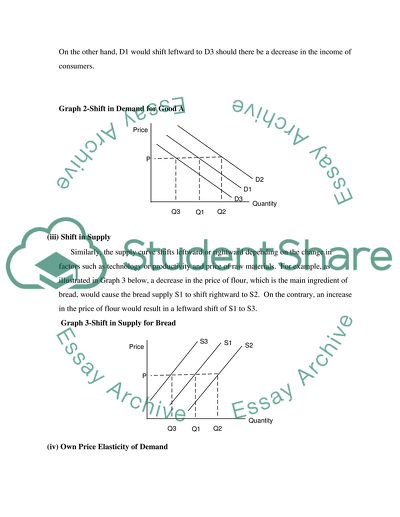
Economics Section Write a paragraph to explain each of the following terms. You must include at least one diagram in your overall answer, but may use more if you wish. (i) Market equilibrium price and quantity In economic terms, market equilibrium refers to the point where the quantity demanded and supplied are equal at a particular price level. It is the point where the demand curve intersects with supply curve (see Graph 1 below). Graph 1- Market Equilibrium Price and Quantity The equilibrium price and quantity are reached as the buyers and sellers bargain until they agree upon the specific level of price at which both are willing to demand and supply the same quantity. In a state of equilibrium, no shortage or excess in quantity arise since quantity demanded and supplied are deemed equal. (Samuelson & Nordhaus) (ii) Shift in Demand A shift in the demand curve for a good is brought about by various factors such as income, population, price of a substitute or complement, consumer taste or preference and expectation among others. A change in any of these factors would lead to a rightward or leftward shift in the demand curve depending on the direction of the change (Begg, Fischer & Dornbusch). For instance, an increase in the income of consumers causes a corresponding increase in the demand for normal good A, with price level remaining the same. Given Graph 2, demand curve D1 would shift rightward to D2 in view of the increase in income. On the other hand, D1 would shift leftward to D3 should there be a decrease in the income of consumers. Graph 2-Shift in Demand for Good A (iii) Shift in Supply Similarly, the supply curve shifts leftward or rightward depending on the change in factors such as technology or productivity and price of raw materials. For example, as illustrated in Graph 3 below, a decrease in the price of flour, which is the main ingredient of bread, would cause the bread supply S1 to shift rightward to S2. On the contrary, an increase in the price of flour would result in a leftward shift of S1 to S3. Graph 3-Shift in Supply for Bread (iv) Own Price Elasticity of Demand The price elasticity of demand measures the sensitivity of the quantity demanded of a good to its price (“Wikipedia”). This is derived by the equations as follows: Ed = (Q2-Q1)/Q1 (P2-P1)/P1 The absolute value of the answer to the above equation would indicate how a percentage change in the price would affect the quantity demanded. Demand is considered elastic if the computed elasticity is greater than 1. This means that a 1% change in the price of good A would be accompanied by a more than proportionate change in quantity demanded. If the derived price elasticity is less than 1, this means that demand is relatively inelastic. Thus, a 1% change in the price of good A would result in a less than proportionate change in the quantity demanded. (Samuelson & Nordhaus) Commodities, which are not very basic and have many substitutes, usually have elastic demand curves. However, basic commodities and utilities like electricity and oil or petroleum products commonly have inelastic demand curves. The analysis of the price elasticity of demand is a helpful tool in determining the magnitude of the firms’ planned increase or decrease in the price of goods. Firms are able to maximize their revenues if they are able to derive the demand elasticity of consumers. (Samuelson & Nordhaus) (v) Own Price Elasticity of Supply In the same way, the price elasticity of supply, the equation of which is as follows: Es = (Q2-Q1)/Q1 (P2-P1)/P1 indicates the percentage change in supply resulting from a given percentage in price. The elasticity of supply curve derived denotes how the supply would react in response to an increase in price. (Begg, Fischer & Dornbusch) It should be noted, though, that the time period is a factor to be considered for the price elasticity of the supply curve. In the short run, the supply curve of most goods is relatively more inelastic as compared to the long run supply curve. This is because it takes time for firms to respond to the signal of increasing price especially if stocks are not sufficient to address the desired increase in quantity supplied. (“Wikipedia”) Section-2: The graph shows the long term trend in the prices of oil. Using the terms set out in section-1 explain why the price of oil is subject to wide fluctuations and why it has risen so much in recent times. The price of oil is primarily determined by the interplay of demand and supply (“Wikipedia”). In this regard, sudden changes in the oil price occur as a result of changes in supply and demand of oil. However, the price of oil has apparently undergone wide fluctuations primarily due to the nature of the product and the industry. Majority of the total global oil output is controlled by the Organization of Petroleum Exporting Countries (OPEC), a cartel comprised of oil-rich nations such as the United Arab Emirates, Saudi Arabia, Kuwait and other Middle East countries. In 1960, these countries formed the cartel which enabled them to collude to raise the oil price by restricting oil production or reducing output quotas of member countries. (“Oil Industry”) OPEC’s decisions in terms of production and quotas have a significant effect on the price of oil. To illustrate this point, as seen in attached Graph 4 (Major Events and Real World Oil Prices, 1970-2005), the OPEC-initiated export oil embargo by the major Arab oil-producing states to signify their protest for western nations’ support of Israel, caused a dramatic escalation in the price of oil in 1973 (“Wikipedia”). Similarly, oil price rose sharply in 1999 due to OPEC oil supply cutbacks. These actions undertaken by OPEC resulted in the leftward shift of the supply curve. From an initial market equilibrium price and quantity, a leftward shift in supply would result in the lower quantity and higher price. Aside from this, price of oil is largely affected by the political turmoil between oil-exporting countries. For instance, the 1979 war between Iran and Iraq, two of the largest oil suppliers in the world, had resulted in a drastic increase in the price of oil. The war also limited the means to transport oil to the rest of the world. The same can be attributed to Iraq’s invasion of Kuwait and the Gulf War. On the demand side, consumption of oil is also substantially reliant on the global economic condition. As such, in times of economic downturns particularly during the Asian crisis in 1997 and the resulting economic weakness in the aftermath of the 9/11 attacks in 2001, there were notable reduction in the demand for oil. This resulted in an oversupply condition which had driven down the price of oil. Recent increases in the oil price was brought about by the rapidly increasing demand to address the growth in the world’s energy requirements coupled with the US-Iraq war and tight oil supply margins (“Wikipedia”). The wide fluctuations in oil price could also be attributed to the price elasticity of demand and supply. In terms of demand, consumption of oil is said to be relatively inelastic since this product is much needed to fuel or provide energy for various industries and other business-related activities. In this regard, a given percentage change in the price of oil would cause a less than proportionate change in demand. On the supply side, if the ability of the cartel to collude and limit output is disregarded, the short-run supply of oil is deemed to be relatively inelastic due to the existing constraint in production capacity or low inventory level. For these reasons, the short run oil supply would not be able to match the percentage increase in oil price resulting from demand surge. Section-3: Give your manager your view on how you think oil prices will move in the next year or so. Given the prevailing trend in the last three years, I believe that the price of oil will further move upward in the near term. This is because there is a general movement towards economic recovery in various countries, which is spurred by more favorable business climate. Furthermore, there is also the emerging market of China that will require additional oil supply to meet their growing energy requirements. With this upswing in overall demand, the oil producers may not be able to adjust production capacity, specifically in the short run. The situation may be depicted in Graph 5 below. Graph 5-Projected Oil Price Movement Graph 4- Major Events and Real World Oil Prices, 1970-2005 References Begg, D., Fischer, S. & Dornbusch, R. Foundations of Economics. McGraw-Hill Inc. 2002. “Oil Industry.” The Columbia Electronic Encyclopedia, 6th ed. Columbia University Press. 2003. Samuelson, P. & Nordhaus, W. Economics. McGraw-Hill Inc. 1992. Wikipedia. 25 October 2005 Read More
Cite this document
  • APA
  • MLA
  • CHICAGO
(“Economics graphs Statistics Project Example | Topics and Well Written Essays - 1250 words”, n.d.)
Economics graphs Statistics Project Example | Topics and Well Written Essays - 1250 words. Retrieved from https://studentshare.org/macro-microeconomics/1535192-economics-graphs
(Economics Graphs Statistics Project Example | Topics and Well Written Essays - 1250 Words)
Economics Graphs Statistics Project Example | Topics and Well Written Essays - 1250 Words. https://studentshare.org/macro-microeconomics/1535192-economics-graphs.
“Economics Graphs Statistics Project Example | Topics and Well Written Essays - 1250 Words”, n.d. https://studentshare.org/macro-microeconomics/1535192-economics-graphs.
  • Cited: 0 times

CHECK THESE SAMPLES OF Economics graphs

The Bush Tax Cuts and the Deficit

‘Extend Tax Policies' is one of the major variables that the graphs illustrates and it demonstrates the anticipated trend of deficit.... It consolidates the variables in one graph and allows for easier comparison than if the variables were represented in separate simple line graphs....
3 Pages (750 words) Research Paper

Economics Indicator Paper and Graph

The housing industry is more at home with the classical theories, classical theorist were referred to as classical theorist because any economic theory developed after them have borrowed a leaf from them, they are also referred to as classical because of their unquestionable explanation of economics and because they brought order into economic enquiry.... bm=y&-geo_id=04000US06&-qr_name=ACS_2006_EST_G00_DP4&-ds_name=ACS_2006_EST_G00_&-_lang=en&-redoLog=falsePhilip Hardwick (2004) Introduction to Modern economics, Pearson Press, New York...
2 Pages (500 words) Essay

Statistical techniques for investment, finance or economic problems

In 2002, in the aftermath of the technology meltdown, the Federal Reserve drops benchmark interest rates, and the ensuing loss of income for banks and lending institutions prompted the Wall Street bright boys to design new securities for investors such as pension funds, foreign… Called mortgage-backed securities and collateralized debt obligations, such instruments were intended to reduce and disperse risks....
30 Pages (7500 words) Essay

Economic Efficiency Issues

The term refers to the production of maximum goods at the minimum possible cost.... Economic efficiency includes two broad concepts.... One concept states that the production should be done at the minimum possible cost and there… This concept is covered under the heading of cost efficiency....
4 Pages (1000 words) Research Paper

Unemployment in Mexico and USA and Comparison between them

Unemployment level was showing a decreasing trend internationally, as presented in the graphs below, until the economic recession that hit the world global market.... The following graphs present the overall analysis of unemployment level (ILO, 2013) (ILO, 2013) Unemployment level in United States and Mexico also increased drastically after recession.... ?Principles of economics.... ?economics....
1 Pages (250 words) Essay

One Subject Infographic

Simply put, the information presented in forms of graphs. My research used the Infographic technique to… My topic therefore was safety of using marijuana.... The data and information was presented using graphs 1 and 2 as shown below.... This technique is referred to as Info-graphic....
3 Pages (750 words) Assignment

Labor Market for Math and Science Teachers

You can fill in the graphs by hand.... On separate graphs for Jack and Jill (copy-paste the grid below twice), graph the individual production possibility frontier and the per capita joint production possibility frontier for Jack and Jill.... … Lecturer Paper Instructions: Type all of your written answers....
6 Pages (1500 words) Assignment

Effect of Government Expenditure on Economic Growth of the USA

The author of this research proposal "Effect of government expenditure on the economic growth of USA" presents definitions of government expenditure and economic growth, government expenditure, USA's economic history, and USA's current economy, theories of Keynesian and Rahn.... nbsp;… Their argument mostly implies that an increase in government spending it is an indication that more money is going to the people's pockets which is a good boost towards economic growth....
9 Pages (2250 words) Research Proposal
sponsored ads
We use cookies to create the best experience for you. Keep on browsing if you are OK with that, or find out how to manage cookies.
Contact Us